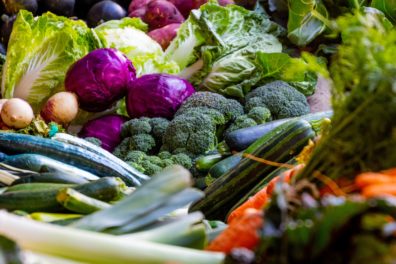
Sep 1, 2020Top 10 vegetables increased in dollar sales versus year ago
Entering the latter half of August, the very different nature of this year’s back-to-school season is becoming evident. Wave 17 of the IRI COVID-19 shopper impact survey, conducted between Aug. 7-9, finds a growing number of parents reporting their school-aged children will be partaking in virtual education only.
“Younger children, ages seven to 12, have the highest likelihood of online versus in-classroom education, as reported by 58% of parents,” said Jonna Parker, Team Lead Fresh for IRI. “An additional 17% of parents with kids in elementary and middle school report their kids will follow a hybrid online and in-person format. Among parents with students ages 13 to 17, 52% reported their children will partake in virtual education only, with an additional 20% in hybrid formats. With more than half of children at home versus in school, this is likely going to change the demand curve once more, particularly for snack packs, single serve items and other popular lunch box and snack fruits and vegetables.”
There is, however, some indication that the stocking-up behavior is starting to ease, according to the IRI survey. Parker added, “Down from 41% in early July, still 34% of shoppers remain focused on making fewer, larger groceries trips to minimize in-store visits. And down from 30%, now only 25% are stocking up on pantry staples/essentials more than usual. These changes go hand-in-hand with concerns over COVID-19 easing very slightly, but 57% of the population now being extremely concerned down from a high of 60%. Earlier drops in new case counts prompted engagement with foodservice and we may see consumers re-engage with restaurants in the next few weeks and months as meal planning and preparation fatigue has set in for many.”
The net effect for fresh produce was a near mirror week of the last based on strong everyday demand that sits about 10% above last year’s levels. For the week of Aug. 16, fresh fruit and vegetable sales increased 10.4% over 2019. Frozen fruits and vegetables had a much higher percentage increase, but is the smallest of the three temperature zones. Year-to-date through August, fresh produce department sales are up 11.2% over the same time period in 2019. Gains for shelf-stable fruits and vegetables were lower than that of fresh driven down primarily by single-digit (+9.6%) growth for shelf-stable fruit. Frozen fruit and vegetables increased the most, up 27.0% year-to-date.
| Dollar sales gains total store fruit/vegetables versus year ago | ||
| Week ending 8/23 | Year to date through week ending 8/23 | |
| Frozen | +21.0% | +27.0% |
| Shelf stable | +13.6% | +23.9% |
| Fresh produce department | +10.4% | +11.1% |
Source: IRI
“Ever since the end of June, growth rates for fresh produce have averaged between 8% and 12%,” said Joe Watson, VP of Membership and Engagement for the Produce Marketing Association (PMA). “It appears that we are looking at a new normal that rides about 10% above last year’s levels. We have Labor Day coming up, a very different back-to-school landscape and we are about to switch over from soft fruit season to fall items. This is likely to prompt very different categories leading growth than we have seen these last few months on the fruit side.”
Fresh produce
The small decline in fresh produce buyers during the 26-week period ending Aug. 23 versus the same period in 2019 was easily offset by higher trip conversion and spend per trip. Household penetration dropped a slight 0.2%, but when in-store, more consumers purchased fresh produce, boosting the number of fresh produce trips by 5.9%. Additionally, they spent more per trip, up 7.6% and more per buyer, up 13.8%.
| Engagement with fresh produce | 26 w.e.
8/23/2019 |
26 weeks w.e. 8/23/2020 |
Change |
| Household penetration | 98.8% | 98.6% | -0.2% |
| Trips | 35.7x | 37.8x | +5.9% |
| Spend per buyer | $283 | $322 | +13.8% |
| Spend per trip | $7.93 | $8.53 | +7.6% |
Fresh fruit also saw a jump in product trips, spend per buyer and spend per trip, but not to the extent of fresh vegetables. This explains the superior performance of fresh produce throughout the pandemic.
| Engagement with fresh fruit | 26 w.e.
8/23/2019 |
26 weeks w.e. 8/23/2020 |
Change |
| Household penetration | 96.8% | 96.6% | -0.3% |
| Trips | 26.1x | 27.1x | +3.8% |
| Spend per buyer | $147.93 | $161.74 | +9.3% |
| Spend per trip | $5.66 | $5.98 | +5.7% |
Fresh vegetables improved all measures: buyers, trips and spend per trip/buyer, which has translated in all those months of double-digit gains for vegetables.
| Engagement with fresh vegetables | 26 w.e.
8/23/2019 |
26 weeks w.e. 8/23/2020 |
Change |
| Household penetration | 97.2% | 97.5% | +0.2% |
| Trips | 25.1x | 27.6x | +10.0% |
| Spend per buyer | $140.62 | $166.01 | +18.1% |
| Spend per trip | $5.61 | $6.02 | +7.3% |
Fresh produce generated $1.31 billion in sales the week ending August 23 — an additional $123 million in fresh produce sales over the prior year. This is below the pandemic average for additional dollars, at $179 million per week, as everyday demand is settling in around that +10% above year ago.
Fresh share
The fresh produce share of total fruit and vegetable sales across all three temperature zones was 81.4% during the week ending August 23 — eroding a little each week with a continued elevated share for frozen items. “Frozen foods in general have seen very strong pandemic sales,” said Parker. “Frozen foods, including fruit and vegetables, have seen an increase in basket size, buyers and trips.”
| Share of total store fruit/vegetable sales | |||||||||||
| 2019 | 3/15 | 3/22 | 3/29 | April
(4/5-4/26) |
May
(5/3-5/31) |
June
(6/7-6/28) |
July
(7/5-7/26) |
8/16 | 8/23 | ||
| Fresh | 84% | 70% | 70% | 76% | 78% | 81% | 82% | 83% | 82% | 81% | |
| Shelf stable | 10% | 19% | 19% | 14% | 13% | 11% | 10% | 10% | 10% | 11% | |
| Frozen | 6% | 11% | 11% | 10% | 10% | 9% | 8% | 7% | 8% | 8% | |
Fresh produce dollars versus volume
Ever since the week of May 24, dollar gains have outpaced volume gains, but this week the gap narrowed to just 1.5 percentage points, much lower than last week’s 2.6 points. However, a look at category-level inflation and deflation across categories is important as throughout the pandemic period, items with high inflation versus deflation have been counterbalancing each other.
Both fruit and vegetables saw dollar sales gains track ahead of volume gains. Vegetable volume growth remained in double digits during the week ending Aug. 23.
| Growth over comparable week in 2019 for week ending… |
||||||||
| 3/1 | March (3/8-3/29) |
April (4/5-4/26) |
May
(5/3-5/31) |
June
(6/7-6/28) |
July
(7/5-7/26) |
8/16 | 8/23 | |
| Vegetables | ||||||||
| Dollars | +1% | +25.8% | +21.5% | +22% | +16.1% | +16.1% | +13.5 % | +13.8% |
| Volume | 0% | +35.0% | +28.9% | +23.4% | +12.5% | +13.3% | +11.3% | +12.8% |
| Fruit | ||||||||
| Dollars | -1% | +14.9% | +8.7% | +11.0% | +6.9% | +7.1% | +9.9% | +7.5% |
| Volume | +3% | +16.3% | +10.7% | +12.8% | +5.9% | +4.7% | +7.3% | +6.2% |
Absolute dollar gains
During the week of August 23, berries held on to their number one slot in terms of absolute dollar gains versus the same week year ago. Berries contributed $20 million in new sales versus year ago, followed by lettuce with an additional $17 million and melons, at +$10 million. “The top 10 in absolute dollar gains saw several changes once again,” said Watson. “Cherries dropped down a few notches but berries and melon sales remained very strong. Mushrooms have been a pandemic powerhouse in retail, with top 10 appearances every single week. One item that is missing this week is oranges, only the third time they did not make the top 10 in absolute dollar gains, even though sales increased 19.2% over the same week year ago.”
| Versus comparable week in 2019 | |||
| Top 10 produce items in absolute dollar growth | Absolute dollar gain w/e 8/23 |
Dollar % growth w/e 8/23 |
Total dollar sales w/e 8/23 |
| Berries | +$20.1M | +17.4% | $136M |
| Lettuce | +$16.9M | +11.2% | $167M |
| Melons | +$10.3M | +14.5% | $81M |
| Tomatoes | +$9.9M | +16.3% | $70M |
| Potatoes | +$8.4M | +16.1% | $61M |
| Cherries | +$7.2M | +31.5% | $30M |
| Peppers | +$7.0M | +18.2% | $45M |
| Mushrooms | +$4.4M | +21.9% | $24M |
| Limes | +$3.3M | +44.9% | $14M |
| Onions | +$3.9M | +9.6% | $44M |
Fresh fruit
“In fruit, berries and melons once more dominated total weekly sales the week of August 23 with double-digit gains over year ago sales,” said Parker. “On the fruit side, we do see several areas with lost ground versus year ago, including grapes, apples, avocados and peaches. For apples and avocados, this is due to deflationary conditions. For instance, volume sales for avocados for the week of August 23 were up 28.1% but dollars are off due to much lower prices than we saw in 2019.”
During the week of Aug.16, double-digit gains in the top 10 sellers were reserved for berries, melons, cherries, tangerines and pineapples.
| Top 10 in weekly sales | Dollar sales increase over comparable week in 2019 for week ending… |
Sales week ending | ||||||||
| 3/1 | March (3/8-3/29) |
April (4/5-4/26) |
May
(5/3-5/31) |
June
(6/7-6/28) |
July
(7/5-7/26) |
8/16 | 8/23 | 8/23 | ||
| Fresh fruit | +0.4% | +14.9% | +8.7% | +10.8% | +6.9% | +7.1% | +9.9% | +7.5% | $653M | |
| Berries | +6.2% | +18.0% | 14.4% | +16.6% | +12.2% | +8.1% | +17.1% | +17.4% | $136M | |
| Melons | +1.6% | -2.2% | -6.8% | +7.6% | -0.5% | +10.0% | +20.0% | +14.5% | $81M | |
| Grapes | +1.8% | +7.2% | -5.5% | -4.7% | -9.7% | -7.3% | -7.9% | -13.0% | $62M | |
| Apples | -3.9% | +16.7% | +4.1% | +2.2% | +1.5% | +2.9% | -4.0% | -4.0% | $61M | |
| Bananas | +2.3% | +15.2% | +9.7% | +5.8% | +2.7% | +2.2% | -0.8% | +0.3% | $58M | |
| Avocados | +3.4% | +19.3% | +17.0% | +13.6% | +6.9% | -0.2% | -0.7% | -0.6% | $45M | |
| Cherries | — | — | — | +17.6% | +33.6% | 15.5% | +49.6% | +31.5% | $30M | |
| Peaches | -3.0% | -0.1% | -35.5% | +31.4% | -5.7% | -0.4% | -5.5% | -5.5% | $27M | |
| Tangerines | -6.3% | +18.9% | +9.3% | -1.2% | +9.3% | +12.2% | +17.7% | +15.0% | $22M | |
| Pineapples | -7.9% | -3.4% | -5.3% | +12.0% | +16.2% | +16.9% | +20.0% | +20.3% | $16M | |
Fresh vegetables
While fruit sales gains were a mix of double-digit, single-digit and negative growth, all top 10 vegetables increased in dollar sales versus year ago and eight in 10 did so with double-digit gains.
The order and items in the top 10 sellers was unchanged from the prior week. Lettuce was the dominant seller, more than twice the size of number two, tomatoes, yet up 11.2% versus the same week year ago. “Salad items have been doing extremely well throughout the pandemic, both convenience-focused bagged salad kits and the individual ingredients,” said Watson. “Salad is a big item in restaurant foodservice as well as in retail foodservice and it appears consumers are replicating that salad occasion at home for lunch and dinner.”
| Top 10 in weekly sales | Dollar sales increase over comparable week in 2019 for week ending… |
Sales week ending | ||||||||
| 3/1 | March (3/8-3/29) |
April (4/5-4/26) |
May
(5/3-5/31) |
June
(6/7-6/28) |
July
(7/5-7/26) |
8/16 | 8/23 | 8/23 | ||
| Fresh veg. | +1.7% | +25.8% | +21.5% | +21.7% | +16.1% | +16.1% | +13.5% | +13.8% | $633M | |
| Lettuce | +3.3% | +13.1% | +11.0% | +13.8% | +11.6% | +8.4% | +10.5% | +11.2% | $167M | |
| Tomatoes | +10.0% | +28.0% | +23.6% | +25.0% | +23.7% | +19.6% | +17.1% | +16.3% | $70M | |
| Potatoes | +0.7% | +64.4% | +50.2% | +37.7% | +21.7% | +19.7% | +15.3% | +16.1% | $61M | |
| Peppers | -2.0% | +21.9% | +26.8% | +28.2% | +25.3% | +22.5% | +18.4% | +18.2% | $45M | |
| Onions | -0.7% | +42.0% | +32.4% | +21.7% | +13.5% | +13.6% | +10.1% | +9.6% | $44M | |
| Mushrooms | +3.1% | +22.6% | +30.3% | +33.7% | +27.8% | +26.2% | +21.0% | +21.9% | $24M | |
| Cucumber | +6.7% | +18.8% | +19.5% | +21.3% | +21.1% | +18.6% | +18.1% | +19.0% | $23M | |
| Carrots | -2.5% | +28.3% | +18.6% | +11.5% | +7.3% | +9.2% | +5.8% | +6.4% | $20M | |
| Broccoli | -2.0% | +19.2% | +18.9% | +20.9% | +14.3% | +19.5% | +10.5% | +10.5% | $18M | |
| Corn | +16.2% | +25.4% | +15.9% | +26.4% | +1.4% | +30.5% | +13.2% | +16.1% | $17M | |
More than three-quarters, 78%, of total lettuce sales was made up by fresh-cut (packaged) salad. Dollar gains for fresh cut salad remained in double digits, at +11.3% versus year ago levels. Volume sales increased 7.9% and units (transactions) grew 8.1%. Year-to-date, retailers have sold an additional 93 million units of fresh-cut salad.
| Dollar sales increase over comparable week in 2019 for week ending… |
Sales week ending | ||||||||||
| 3/1 | March (3/8-3/29) |
April (4/5-4/26) |
May
(5/3-5/31) |
June
(6/7-6/28) |
July
(7/5-7/26) |
8/16 | 8/23 | 8/23 | |||
| Fresh cut salad | +3.9% | +13.3% | +9.1% | +11.8% | +11.6% | +10.1% | +10.3% | +11.3% | $132M | ||
Fresh versus frozen and shelf-stable fruits and vegetables
The week of Aug. 23 was a near mirror image of all the August weeks, with great strength for frozen, canned and fresh vegetables.
Floral
While back in the high single digits, floral sales at retail had another strong week, up 8.7% over the same week last year. With the exception of the week of May 17, sales have been in positive territory since early May.
Perimeter performance
Total store, center store and fresh all remained highly elevated versus year-ago levels. The fresh perimeter was boosted by continued very high meat and seafood sales. “The strength of the meat department during the pandemic has been astounding,” said Parker. “Cross promoting fresh meat and produce may be beneficial to further boost produce sales. We know consumers are fatigued in their ongoing need for increased at-home meals. The fresh perimeter can spark some creativity for them.” Total deli, which encompasses non-UPC, random-weight deli cheese, meat and prepared foods, remained pressured, due to deli-prepared sales’ continued struggles.
What’s next?
The week of August 23rd was the next to last in a series of eight weeks where everyday demand is the driver of the sales performance. Restaurant transactions continue to recover but remain below last year’s levels. Both consumer concern and economic pressure remain high, but stable for the moment. Aided by the effect of virtual schooling, produce sales are likely to hold well above 2019 levels for the foreseeable future, and particular attention should be paid to snackable fruits and vegetable trends to understand the impact of the very different back-to-school season in weeks to come.
210 Analytics, IRI and PMA will continue to provide weekly updates through Labor Day and subsequently switch to a monthly schedule. We encourage you to contact Joe Watson, PMA’s Vice President of Membership and Engagement, at [email protected] with any questions or concerns. Please recognize the continued dedication of the entire grocery and produce supply chains, from farm to retailer, on keeping the produce supply flowing during these unprecedented times. #produce #joyoffresh #SupermarketSuperHeroes
– Anne-Marie Roerink, President, 210 Analytics


