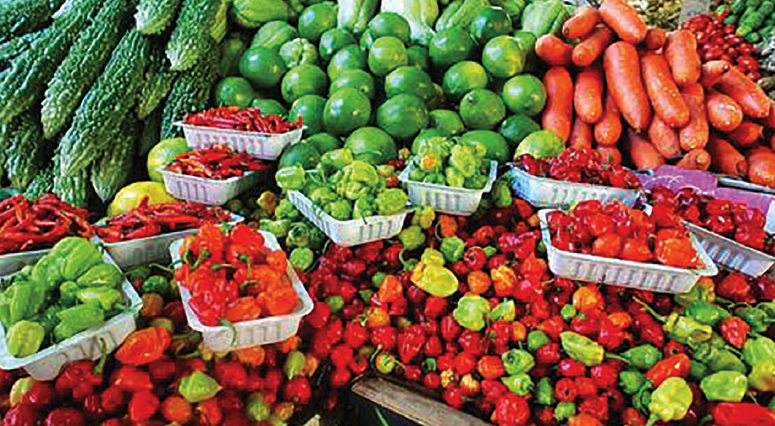
Jul 15, 2020Top 10 vegetables increased in dollar sales versus year ago
All 2020 holidays affected by the coronavirus pandemic have seen strong sales results, from Easter and Mother’s Day to Memorial Day and Father’s Day. Several of these are big restaurant holidays during regular years and dollars shifted to the grocery channel as people celebrated at home.
July Fourth is already a big at-home grilling holiday, which means beating prior year numbers is much harder. At the same time, many states re-strengthened social distancing measures, including restricting restaurant dine-in capacity once more. Concern over the virus among consumers is rising, which could have augmented holiday demand with renewed focus on cooking at home. 210 Analytics, IRI and PMA partnered to understand how produce sales continue to develop throughout the pandemic.
During the week ending July 5, elevated everyday plus holiday demand drove gains of +9.1% for fresh produce – higher than the week prior, but not as high as Father’s Day. Frozen and shelf-stable fruits and vegetables did continue to see double-digit gains, with particular strength for frozen, at +24.4%. Year-to-date, fresh produce sales are up 10.6% over the same time period in 2019. Frozen fruit and vegetables increased the most, up 28.0% year-to-date. This is in spite of limited assortment of frozen vegetables and fruit, down -6.7% in average items per store selling.
| Dollar sales gains total store fruit/vegetables versus year ago | ||
| Week ending 7/5 | Year to date through week ending 7/5 | |
| Frozen | +24.4% | +28.0% |
| Shelf stable | +18.1% | +27.2% |
| Fresh | +9.1% | +10.6% |
Source: IRI
“Independence Day is always a big holiday for fresh produce so this is not an easy bar to beat,” said Joe Watson, VP of Membership and Engagement for the Produce Marketing Association (PMA). “Despite all that has changed amid the pandemic, much is the same as well. Cherries, melons, corn and more all lived up to their holiday strength reputations and helped drive the significant boost over last year’s numbers. Now we need to keep that summer spirit alive in the next seven weeks until Labor Day. We know many people are having staycations, are looking to build their immune systems and yet others are at a loss for new meal ideas. All these are big opportunities for fresh produce.”
Fresh produce
Up from $1.36 billion the final full week of June, fresh produce generated $1.54 billion in sales the week ending July 5 – an additional $129 million in fresh produce sales. Vegetables, up 13.9% from the prior year, had a 8.2 percentage point lead over fruit. Fruit gained 5.2% over last year. This was the second-lowest gain since the week of April 19 (Easter 2019) for both fruit and vegetables, but a big boost over a strong produce week any year.
“Expectations for the holidays were smaller gatherings and unit sales support this assumption,” said Jonna Parker, Team Lead, Fresh for IRI. “Unit purchases in fresh produce increased by 7.1% over the Fourth of July week versus last year, while volume increased 5.1%. This points to more, but smaller, packages sold. This is an important lesson for pre-packaged produce and the types of promotions that will be effective in the current environment. Much like bakery sales are now driven by smaller-sized cakes and personal packages versus 24-pack cupcakes and sheet cakes, adjusting for the new normal in celebrations is important in fresh produce as well.”
Fresh share
While percentage-wise, growth for fresh produce is outdone by frozen and canned, it is important to keep in mind the size of the markets. At $1.5 billion in sales during the week of July 5, fresh produce is significantly larger than shelf stable ($167 million) and frozen fruits and vegetables ($134 million). This means growth percentages for fresh produce are bound to be lower and not reflective of winners in absolute dollar gains or shares.
“We are back!” said Watson. “When consumers were in their stock-up mindset early on in the pandemic, the share of fresh produce versus the total fell as low as 70% from our normal position of about 84%. Slowly but surely fresh produce has recovered its position and the holiday week brought the share back up to 84% for the first time since early March. We have overcome ungrounded shopper concerns about food safety and by educating shoppers about items with longer shelf-life to make it through the week with items for now and items for later, we can further increase our share in the months to come.”
| Share of total store fruit/vegetable sales | ||||||||
| 2019 | 3/15 | 3/22 | 3/29 | April
(4/5-4/26) |
May
(5/3-5/31) |
June
(6/7-6/28) |
7/5 | |
| Fresh | 84% | 70% | 70% | 76% | 78% | 81% | 82% | 84% |
| Shelf stable | 10% | 19% | 19% | 14% | 13% | 11% | 10% | 9% |
| Frozen | 6% | 11% | 11% | 10% | 10% | 9% | 8% | 7% |
Fresh produce dollars versus volume
After narrowing significantly during Father’s Day week, the volume/dollar gap jumped back up to reach its highest point since the onset of the pandemic the week of June 28, at 4.2 percentage points. Independence Day week, the gap was exactly 4 percentage points – mild compared to areas like the meat department.
The gap was driven by both vegetables and fruit. Recovering from being down the week prior, fruit volume gained 3.5% over the same week last year. But fruit dollars outpaced fruit volume during the week ending July 5 by 1.7 percentage points. In vegetables, dollar gains also outpaced volume, at +13.9% versus +7.8%. At 6.1 percentage points, the gap reached its widest point since the onset of the pandemic.
| Growth over comparable week in 2019 for week ending… |
||||||
| 3/1 | March (3/8-3/29) |
April (4/5-4/26) |
May
(5/3-5/31) |
June
(6/7-6/28) |
7/5 | |
| Vegetables | ||||||
| Dollars | +1% | +25.8% | +21.5% | +22% | +16.1% | +13.9% |
| Volume | 0% | +35.0% | +28.9% | +23.4% | +12.5% | +7.8% |
| Fruit | ||||||
| Dollars | -1% | +14.9% | +8.7% | +11.0% | +6.9% | +5.2% |
| Volume | +3% | +16.3% | +10.7% | +12.8% | +5.9% | +3.5% |
The holiday week drove changes among the top 10 highest in absolute dollar gains once more. Jumping from third to first place, berries overtook tomatoes with an additional $14 million in sales the holiday week versus year ago. “The largest fruit category drove the highest absolute dollar gains this week,” said Watson. “Reclaiming the top spot was particularly meaningful for berries given that volume gains outpaced dollar gains by 16.5 percentage points. The holiday week also brought summer holiday powerhouses back into the top 10, including melons and corn. Mushrooms and oranges continue on their incredible sales journeys that started mid March and just do not seem to be slowing down any time soon.”
| Versus comparable week in 2019 | |||
| Top 10 produce items in absolute dollar growth w/e 7/5/2020 | Absolute dollar gain w/e 7/5 |
Dollar % growth w/e 7/5 |
Total dollar sales w/e 7/5 |
| Berries | +$14.1M | +10.0% | $154.2M |
| Tomatoes | +$13.3M | +16.2% | $95.3 M |
| Lettuce | +$11.8M | +7.5% | $169.1 M |
| Potatoes | +$10.3M | +16.8% | $71.4 M |
| Peppers | +$9.1M | +19.8% | $55.0 M |
| Oranges | +$6.9M | +47.6% | $21.5 M |
| Melons | +$6.0M | +5.0% | $125.7 M |
| Corn | +$5.9M | +18.6% | $37.5 M |
| Mushrooms | +$5.2M | +24.4% | $26.7 M |
| Onions | +$4.7M | +9.9% | $52.1 M |
However, dollar gains alone do not tell the full story. Supply and demand continued to be significantly out of balance for some categories. Ample supply is driving higher volume than dollar gains for items such as avocados, celery and berries. On the other hand, dollar gains are far outpacing volume for items such as corn, cherries and asparagus. “Corn on price per volume basis is up 52.6% versus the same week last year,” said Watson. “I remember many years of seeing fresh corn six or eight for a dollar, now I am seeing a lot of two for $1 or three for $2. This results in dollar gains of 18.6%, but volume sales being off 22.3% and can also drive some people to purchasing canned or frozen corn.”
| Volume gains minus dollar gains | Volume gains minus dollar gains |
| +75.0% Papayas (small base) | -40.9% Corn |
| +38.1% Avocados | -15.4% Cherries |
| +28.5% Celery | -12.2% Asparagus |
| +16.5% Berries | -11.5% Roots |
| +14.9% Peppers | -10.6% Beans |
Fresh fruit
“The holiday week brought a much stronger fruit performance,” said Parker. “To start, both dollars and volume were in positive territory. And while the percentage gain may not be as high as ones we saw during March, April and May, fruit sold an additional $39 million versus the holiday week in 2019.”
During Independence Day week, double-digit gains were reserved for berries, oranges and pineapples, with the highest percentage growth yet again going to oranges. Grapes, avocados and peaches lost ground compared with last year, but avocado sales were heavily affected by deflationary conditions.
| Top 10 in weekly sales | Dollar sales increase over comparable week in 2019 for week ending… |
Sales week ending | |||||
| 3/1 | March (3/8-3/29) |
April (4/5-4/26) |
May
(5/3-5/31) |
June
(6/7-6/28) |
7/5 | 7/5 | |
| Fresh fruit | +0.4% | +14.9% | +8.7% | +10.8% | +6.9% | +5.2% | $780M |
| Berries | +6.2% | +18.0% | 14.4% | +16.6% | +12.2% | +10.0% | $154M |
| Melons | +1.6% | -2.2% | -6.8% | +7.6% | -0.5% | +5.0% | $126M |
| Cherries | — | — | — | +17.6% | +33.6% | +4.2% | $86M |
| Bananas | +2.3% | +15.2% | +9.7% | +5.8% | +2.7% | +4.5% | $62M |
| Apples | -3.9% | +16.7% | +4.1% | +2.2% | +1.5% | +3.8% | $60M |
| Grapes | +1.8% | +7.2% | -5.5% | -4.7% | -9.7% | -11.6% | $55M |
| Avocados | +3.4% | +19.3% | +17.0% | +13.6% | +6.9% | -1.8% | $53M |
| Peaches | -3.0% | -0.1% | -35.5% | +31.4% | -5.7% | -4.4% | $22M |
| Oranges | -3.3% | +44.0% | +64.5% | +73.0% | +59.1% | +47.6% | $23M |
| Pineapple | -7.9% | -3.5% | -5.4% | +12.0% | +16.1% | +16.9% | $20M |
Fresh vegetables
In contrast to fruit, all top 10 vegetables increased in dollar sales versus year ago and many did so with double-digit gains. Lettuce, which includes fresh cut salads, were the top sales category, followed by tomatoes and potatoes. “The biggest difference between fresh fruit and vegetables right now is the uniformity in performance across all vegetable categories,” said Parker. “All top 10 areas gained over last year and seven out of 10 did so in double-digits. Wave 14 of our weekly shopper survey showed that consumers are preparing 84% of all meals at home right now. While down a little from a high of 89%, this means continued elevated opportunity across all meal occasions for fresh vegetables.” Making meal planning easy remains one of the biggest opportunities for vegetables. Consumers, who were initially taking to preparing more scratch meals, are running out of meal ideas and craving variety. Pre-pandemic, it was exactly this meal fatigue that drove consumers to restaurants and meal kits instead of cooking at home. Parker added, “The lunch opportunity is also with 38% of the active workforce expecting to be working from home five days per week. This is compared to 15% pre-pandemic.”
| Top 10 in weekly sales | Dollar sales increase over comparable week in 2019 for week ending… |
Sales week ending | |||||||
| 3/1 | March (3/8-3/29) |
April (4/5-4/26) |
May
(5/3-5/31) |
June
(6/7-6/28) |
7/5 | 7/5 | |||
| Fresh vegetables | +1.7% | +25.8% | +21.5% | +21.7% | +16.1% | +13.9% | $737M | ||
| Lettuce | +3.3% | +13.1% | +11.0% | +13.8% | +11.6% | +7.5% | $169M | ||
| Tomatoes | +10.0% | +28.0% | +23.6% | +25.0% | +23.7% | +16.2% | $95M | ||
| Potatoes | +0.7% | +64.4% | +50.2% | +37.7% | +21.7% | +16.8% | $71M | ||
| Peppers | -2.0% | +21.9% | +26.8% | +28.2% | +25.3% | +19.8% | $55M | ||
| Onions | -0.7% | +42.0% | +32.4% | +21.7% | +13.5% | +9.9% | $52M | ||
| Corn | +16.2% | +25.4% | +15.9% | +26.4% | +1.4% | +18.6% | $38M | ||
| Cucumber | +6.7% | +18.8% | +19.5% | +21.3% | +21.1% | +17.4% | $28M | ||
| Mushrooms | +3.1% | +22.6% | +30.3% | +33.7% | +27.8% | +24.4% | $27M | ||
| Carrots | -2.5% | +28.3% | +18.6% | +11.5% | +7.3% | +9.7% | $23M | ||
| Broccoli | -2.0% | +19.2% | +18.9% | +20.9% | +14.3% | +21.4% | $22M | ||
Fresh cut salad continued to be a strong performer over the week ending July 5, with an 9.8% increase in dollars and 5.3% increase in volume. This is one of the many examples across the store that consumers are still looking to mix and match items made from scratch with items that bring convenience and time saving.
| Dollar sales increase over comparable week in 2019 for week ending… |
Sales week ending | ||||||||
| 3/1 | March (3/8-3/29) |
April (4/5-4/26) |
May
(5/3-5/31) |
June
(6/7-6/28) |
7/5 | 7/5 | |||
| Fresh cut salad | +3.9% | +13.3% | +9.1% | +11.8% | +11.6% | +9.8% | $132M | ||
Fresh versus frozen and shelf-stable fruits andvegetables
Frozen fruit and vegetables had another double-digit gains performance during the week ending July 5 versus year ago, and paced well ahead of canned items. The continued strength of frozen fruits and vegetables is remarkable and goes hand-in-hand with strong frozen foods performance overall.
Floral
Floral sales had a strong Independence Day week with dollars 5% over the 2019.
Perimeter performance
The fresh perimeter had a strong week during Independence Day driven by meat and produce, but center store gains once more topped those in fresh, at +14% versus +10%. Both meat and seafood had higher than average gains, but the single-digit performance in produce along with down or flat sales in bakery and deli pulled down the perimeter average.
What’s next?
Independence Day week was the last of the spring and summer holidays, leaving a seven week stretch of regular weeks where everyday demand will need to boost sales past last year’s levels. Wave 14 of the IRI shopper surveys shows that concern over COVID-19 is rebounding as cases rise around the country. Thirty-eight percent now say they are more concerned than they were last week and 41% of Americans are bracing for longer duration, expecting the health crisis to last at least 12 more months.
Given the rising concern and the rolling back of restaurant re-openings, foodservice produce demand may plateau, while consumers once more flock to supermarkets for their produce needs. It is likely that dollar gains at retail will sit above the 2019 baseline for the foreseeable future. Depending on price, volume gains may see some pressure as consumers have been diverting dollars to frozen and canned for high inflationary categories or substituted for lower-priced items.
Please recognize the continued dedication of the entire grocery and produce supply chains, from farm to retailer, on keeping the produce supply flowing during these unprecedented times. #produce #joyoffresh #SupermarketSuperHeroes. 210 Analytics and IRI will continue to provide weekly updates as sales trends develop, made possible by PMA.
We encourage you to contact Joe Watson, PMA’s Vice President of Membership and Engagement, at [email protected] with any questions or concerns.
– Anne-Marie Roerink, President, 210 Analytics


