Nov 15, 2018Illinois stays tops in pumpkin production
Pumpkin production is widely dispersed throughout the United States, with crop conditions varying greatly by region. All States produce some pumpkins but in 2012, about half of pumpkin acres were grown in 6 States and about 80 percent were grown in 16 States (2012 U.S. Census of Agriculture, USDA, National Agricultural Statistics Service (NASS)). In 2017, Illinois remained the largest producer, harvesting about 3-5 times as many pumpkin acres as any of the other top States (Figure 1).
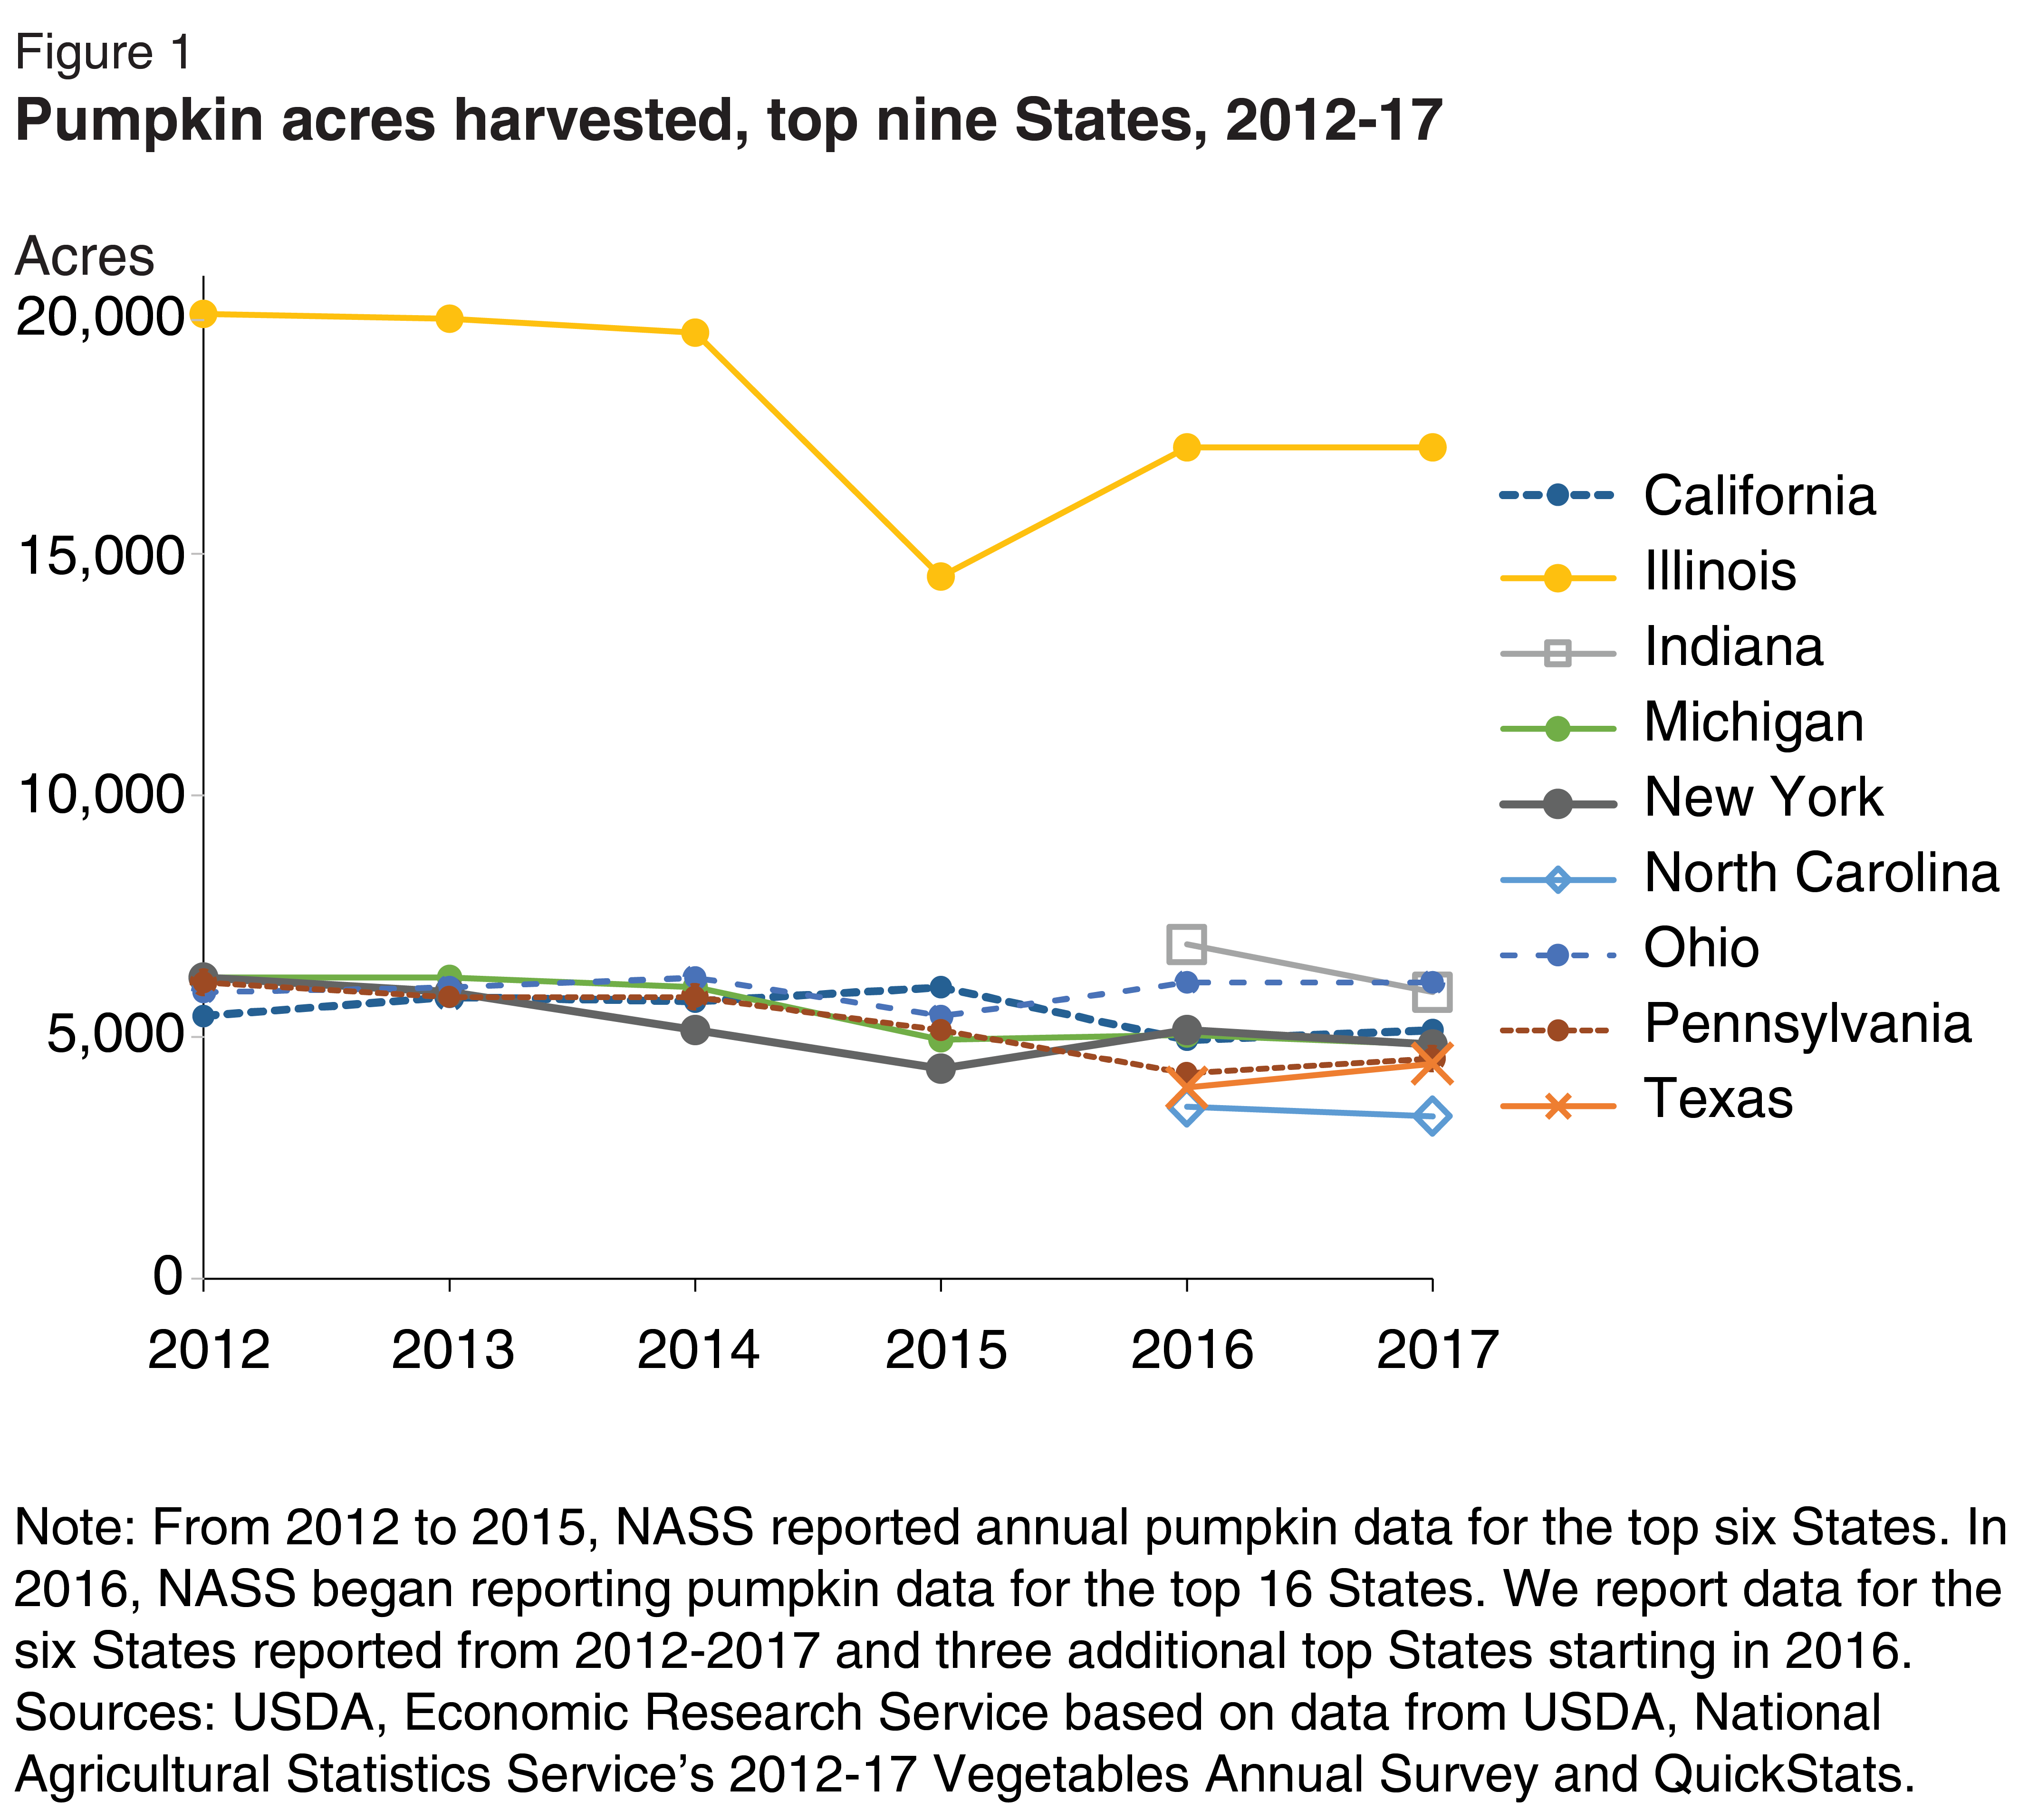
From year to year, the amount of pumpkin acres that U.S. farmers harvest changes up to 25 percent in top States, but averages since 2012 have been fairly stable to slightly declining.
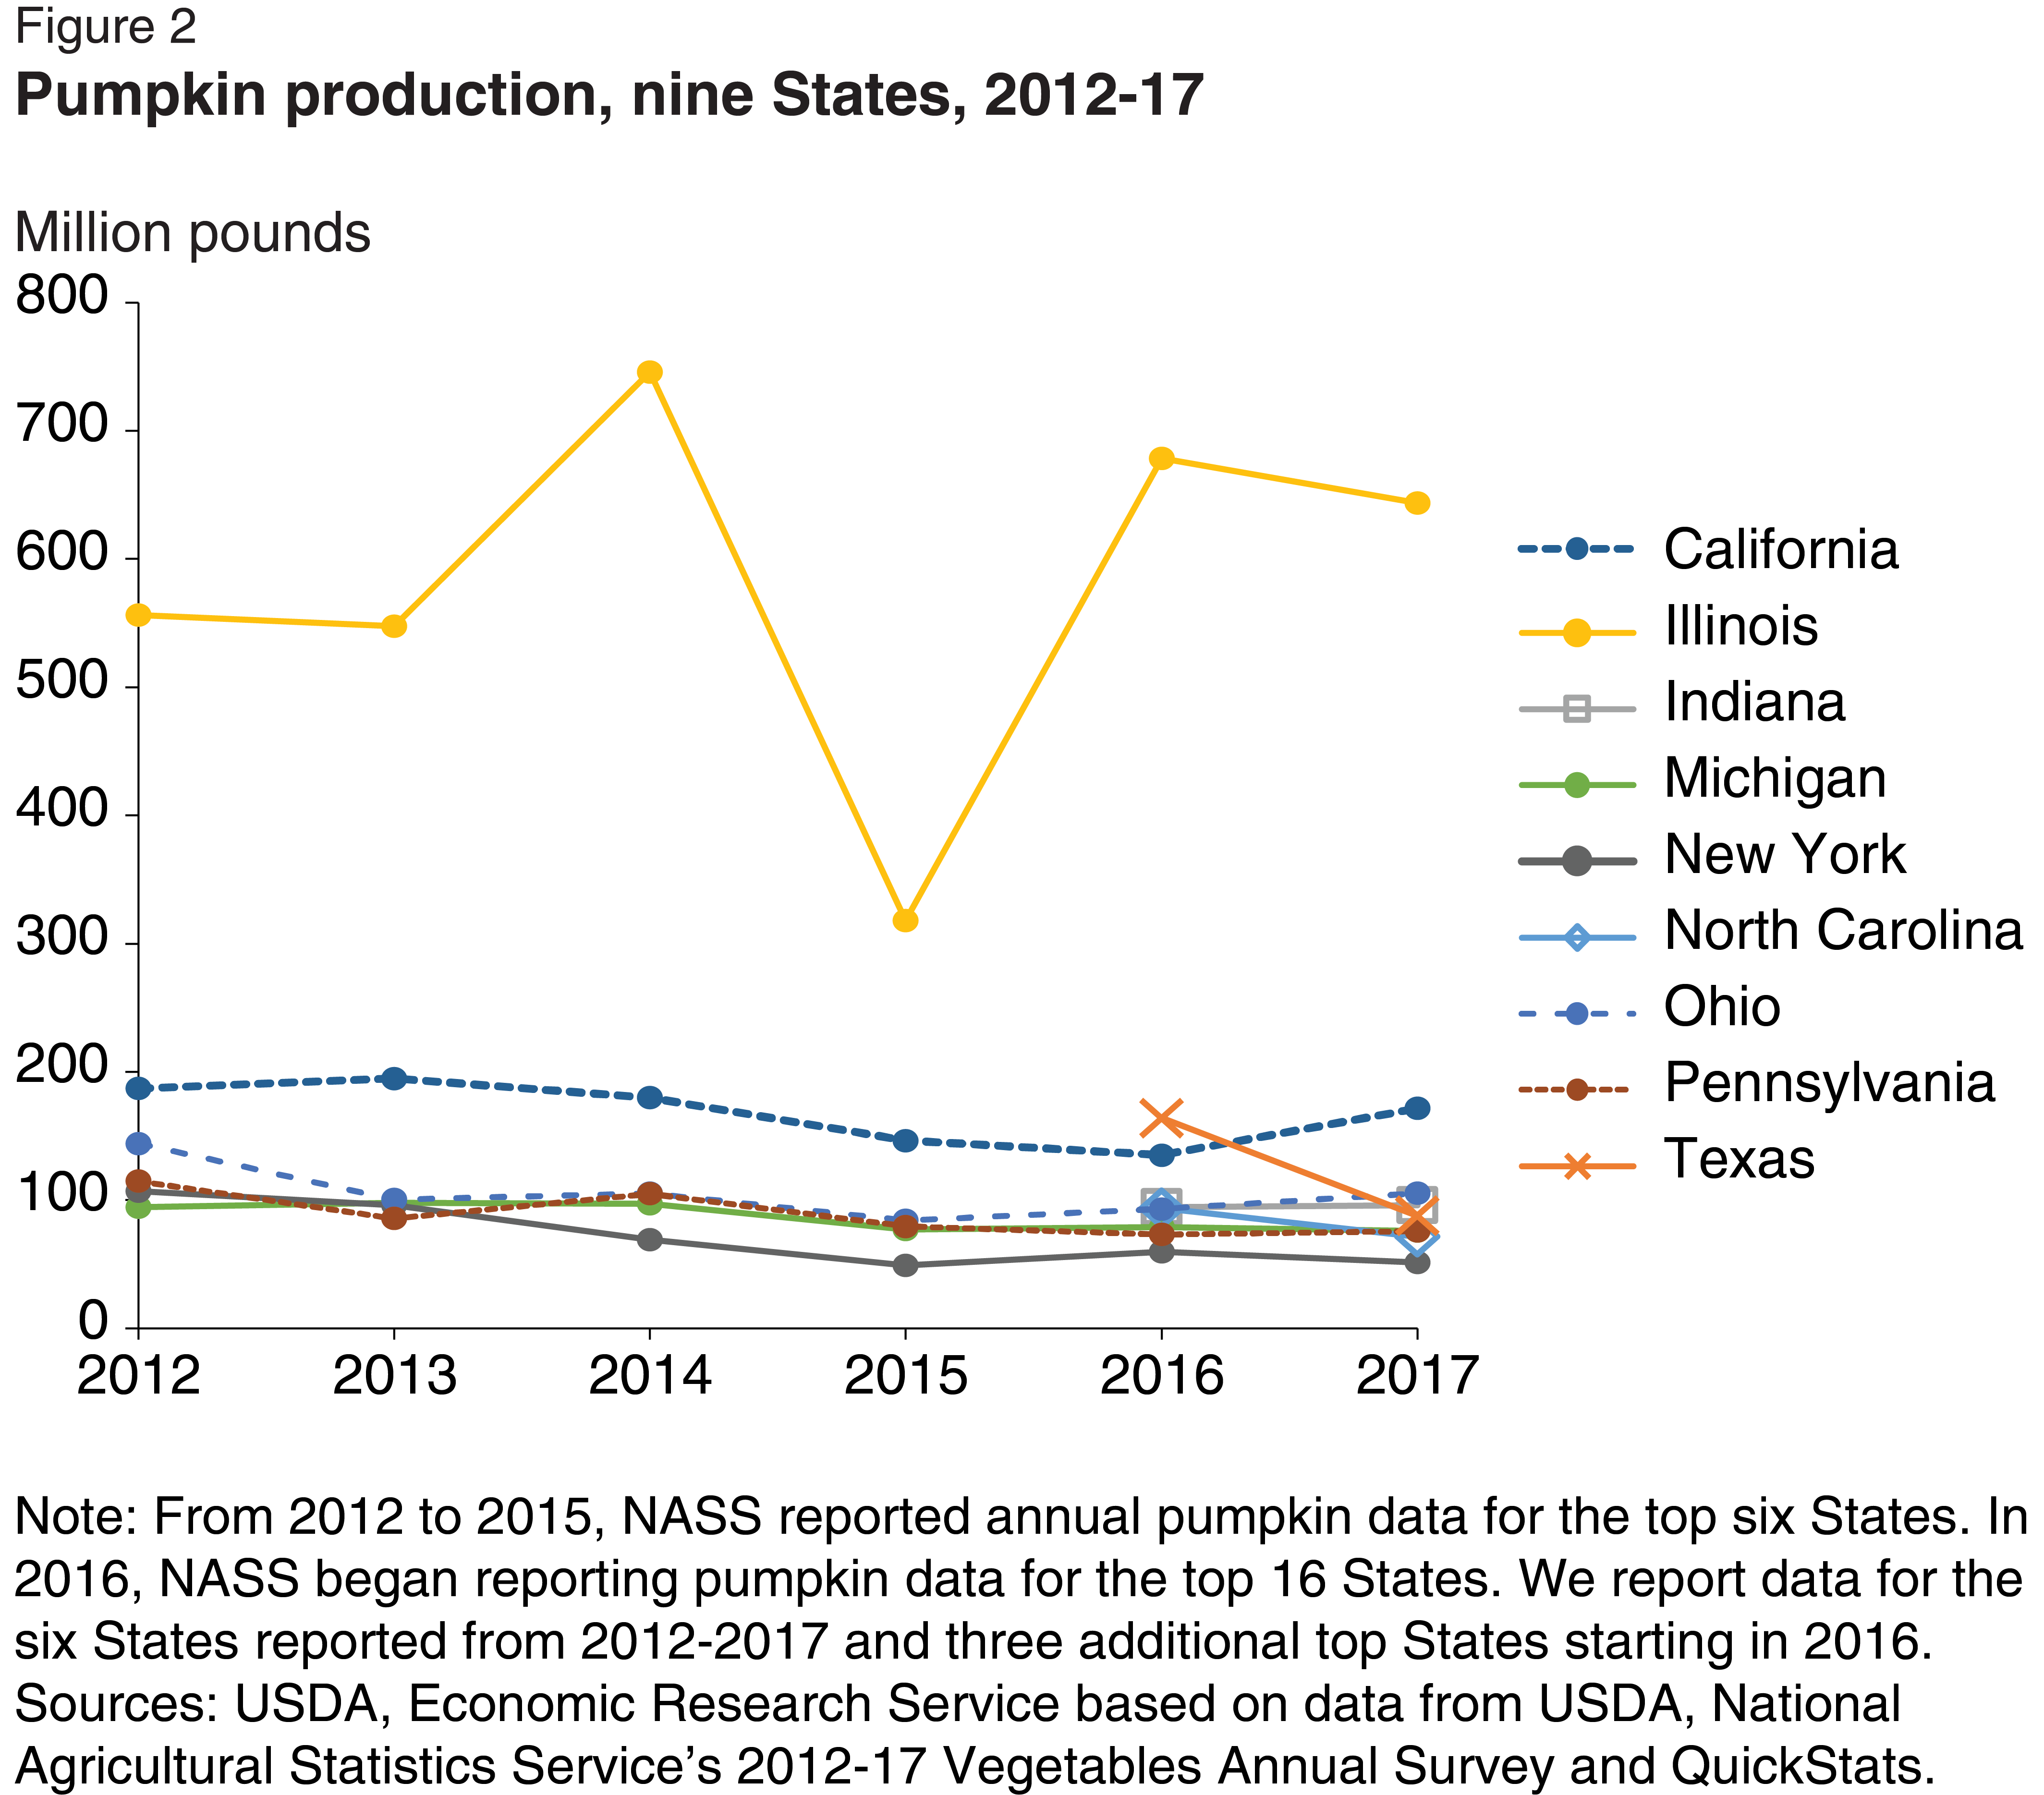
In 2017, farmers in the top 16 pumpkin-producing States harvested 1.5 billion pounds of pumpkins, implying about 2 billion pounds harvested altogether in the United States. Production decreased 7 percent from 2016 but remained far above that of 2015 when late rains severely damaged the pumpkin crop. Illinois production, though highly variable, is seven times the average of the other top eight pumpkin-producing States (Figure 2).
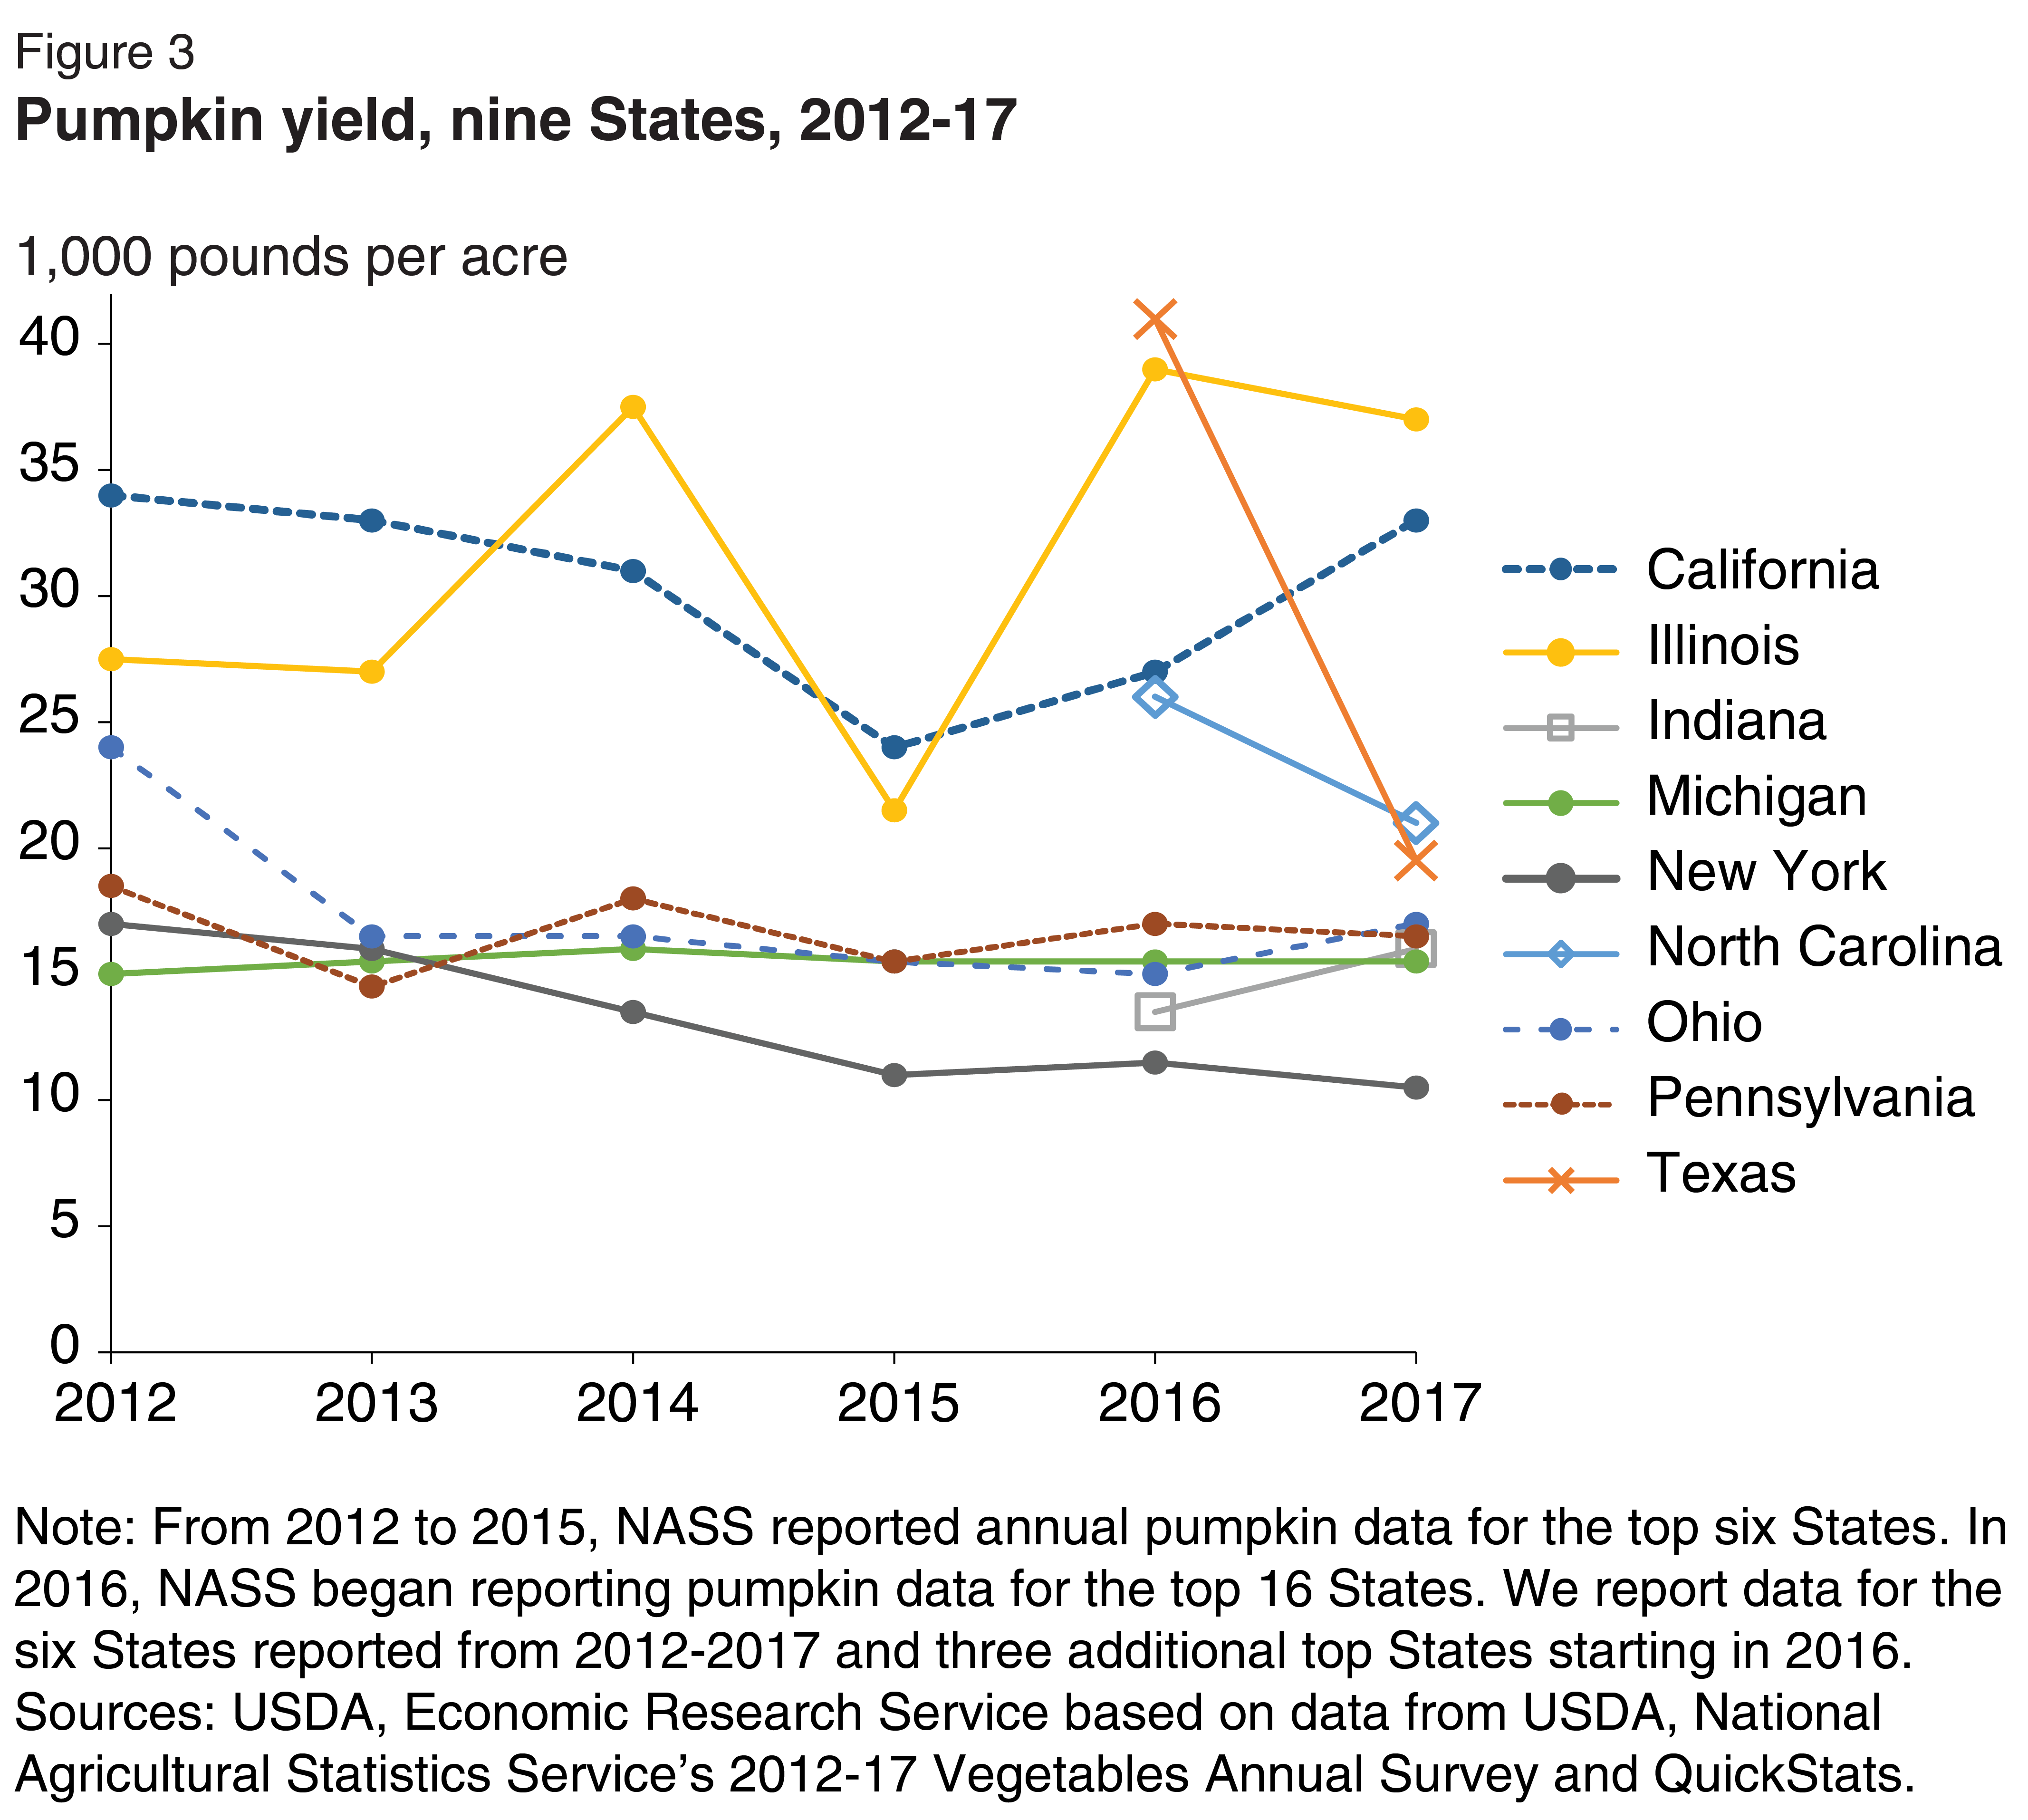
Yield varies between years, especially for Illinois, California, and Texas (Figure 3). (In 2017 late rains impeded the harvest of pumpkins in Texas.) On average, Illinois, California, and Texas grow about 30,000 pounds per acre, North Carolina about 25,000 pounds per acre, while other reported states average about 15,000 pounds per acre.
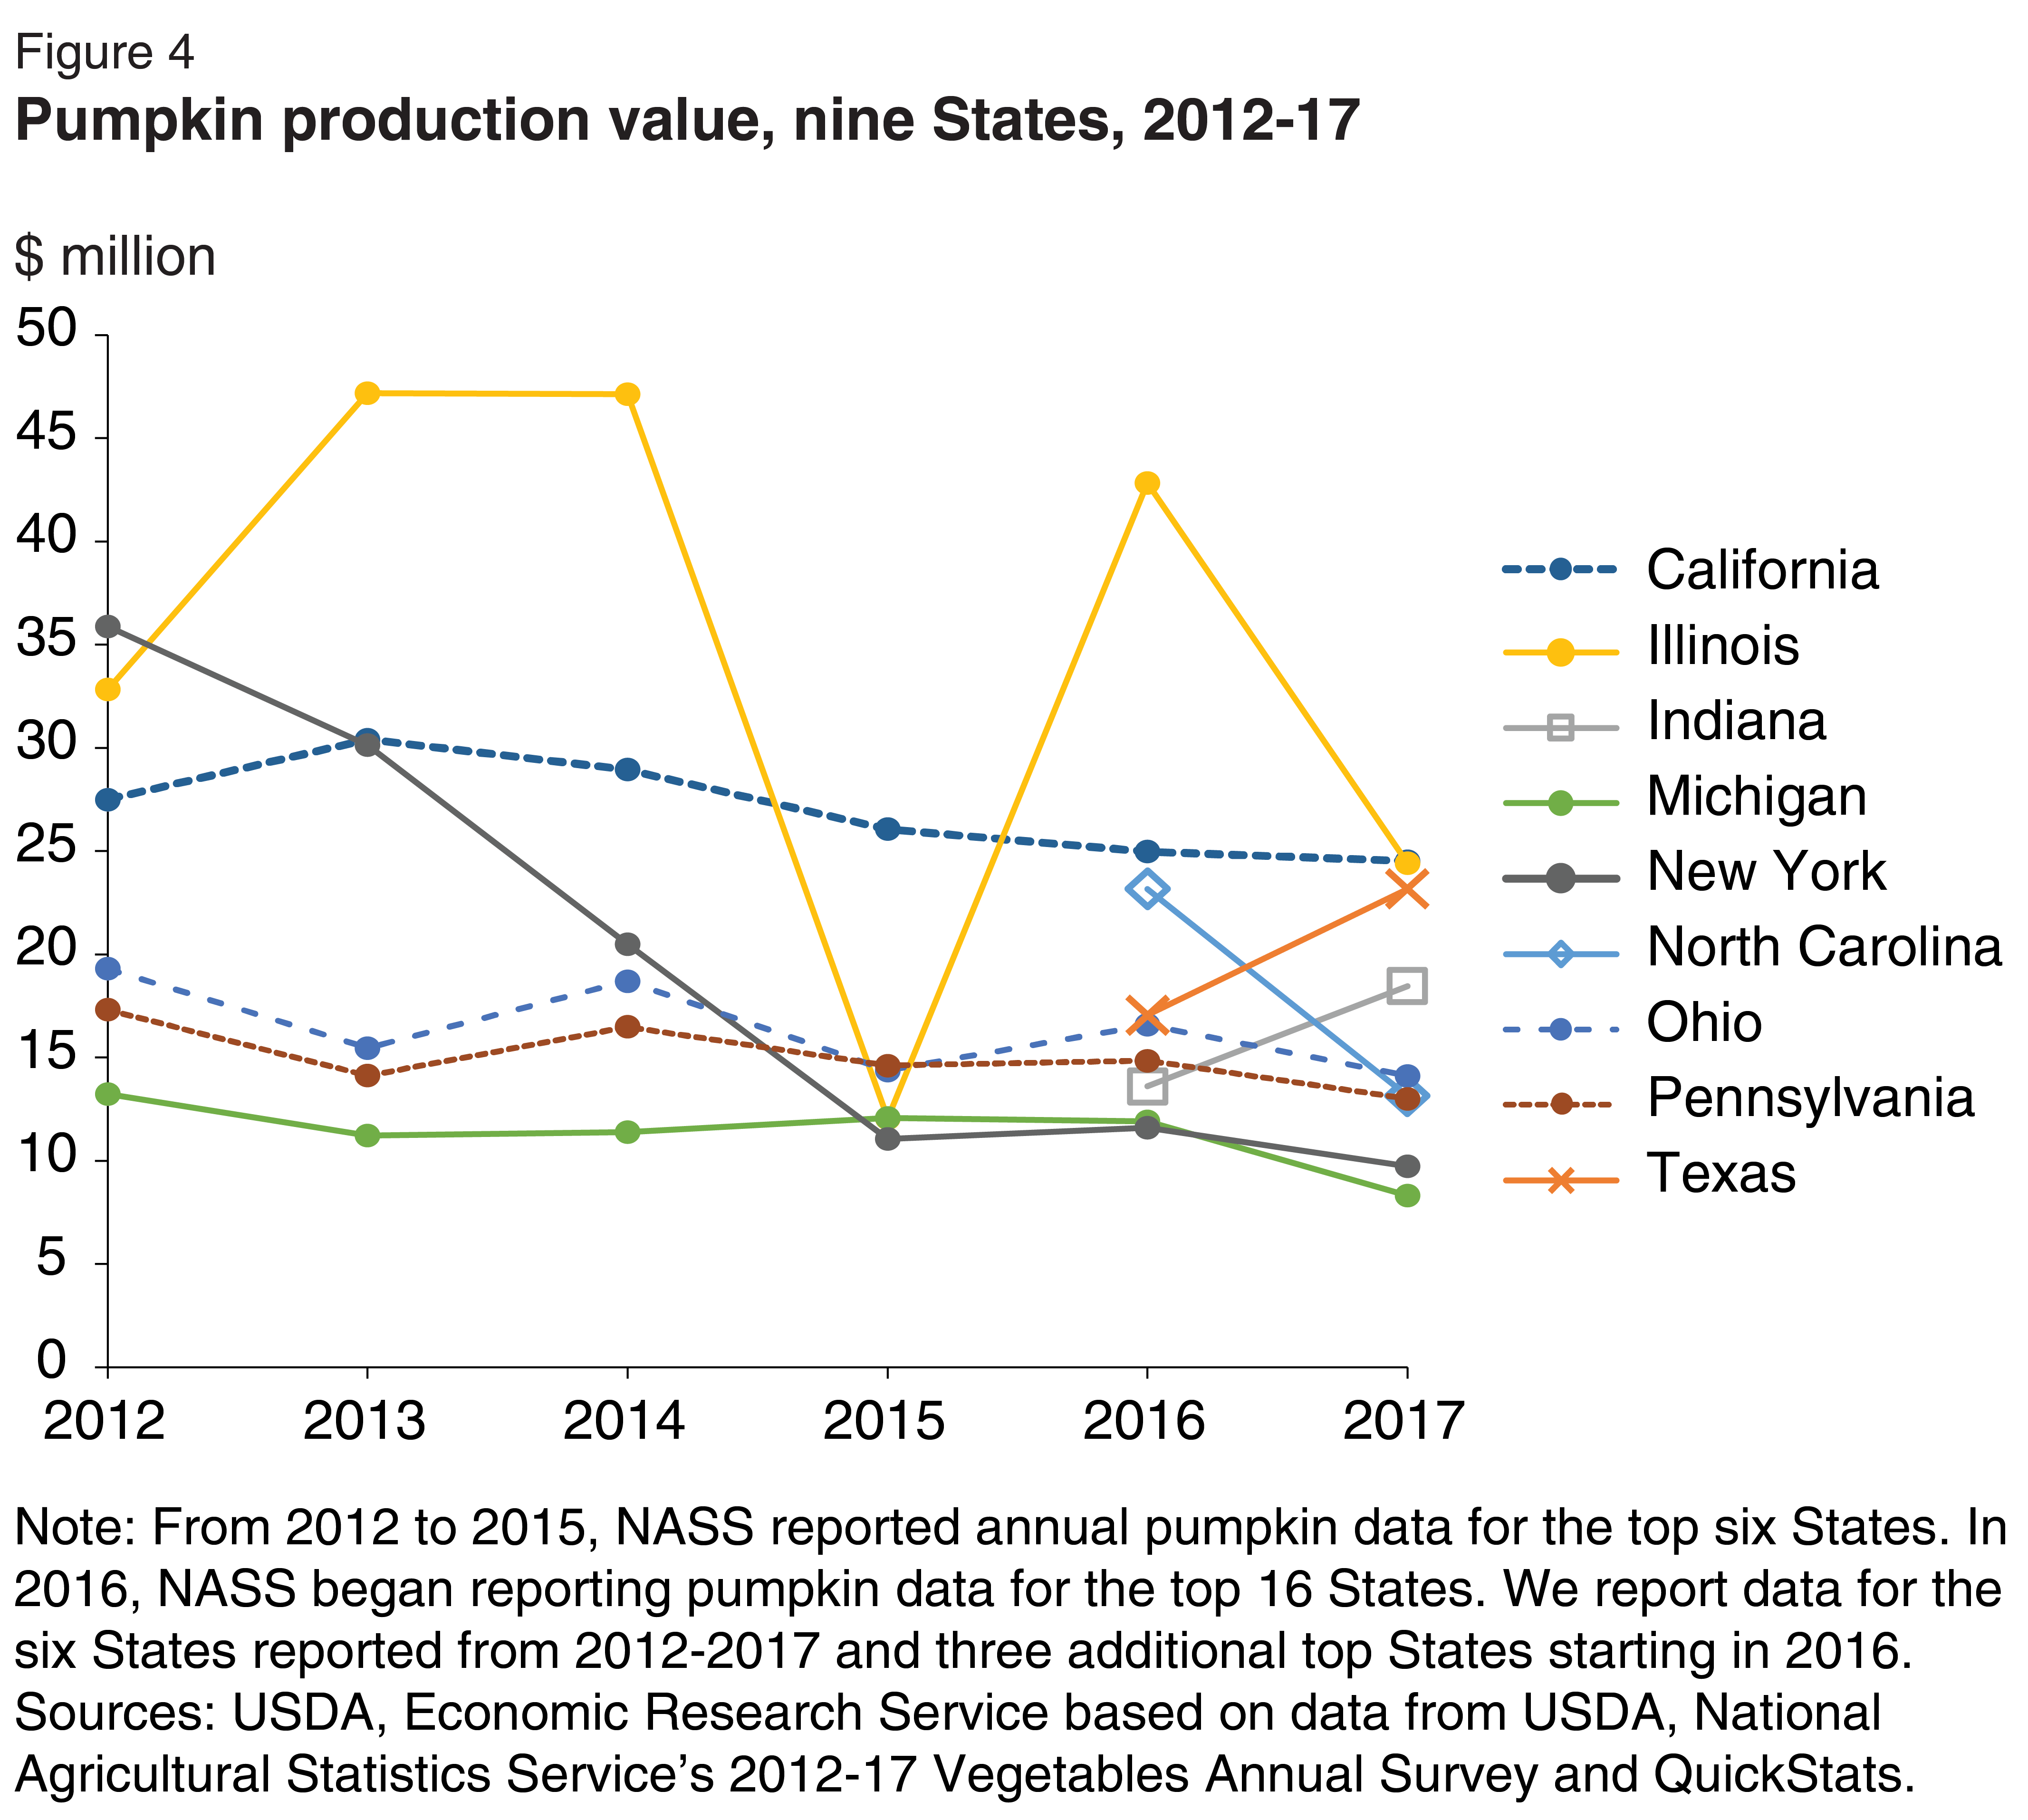
The value of pumpkin production has been highly variable for Illinois and New York (Figure 4). The value of Illinois’ production has exhibited wide swings since 2012, but New York has seen production value drop every year since then. Compared to acreage, output, and yield, Illinois’ advantage over other top-producing States (in terms of production value) is slight because processing pumpkins typically grown in Illinois receive a lower price compared to fresh pumpkins grown elsewhere.
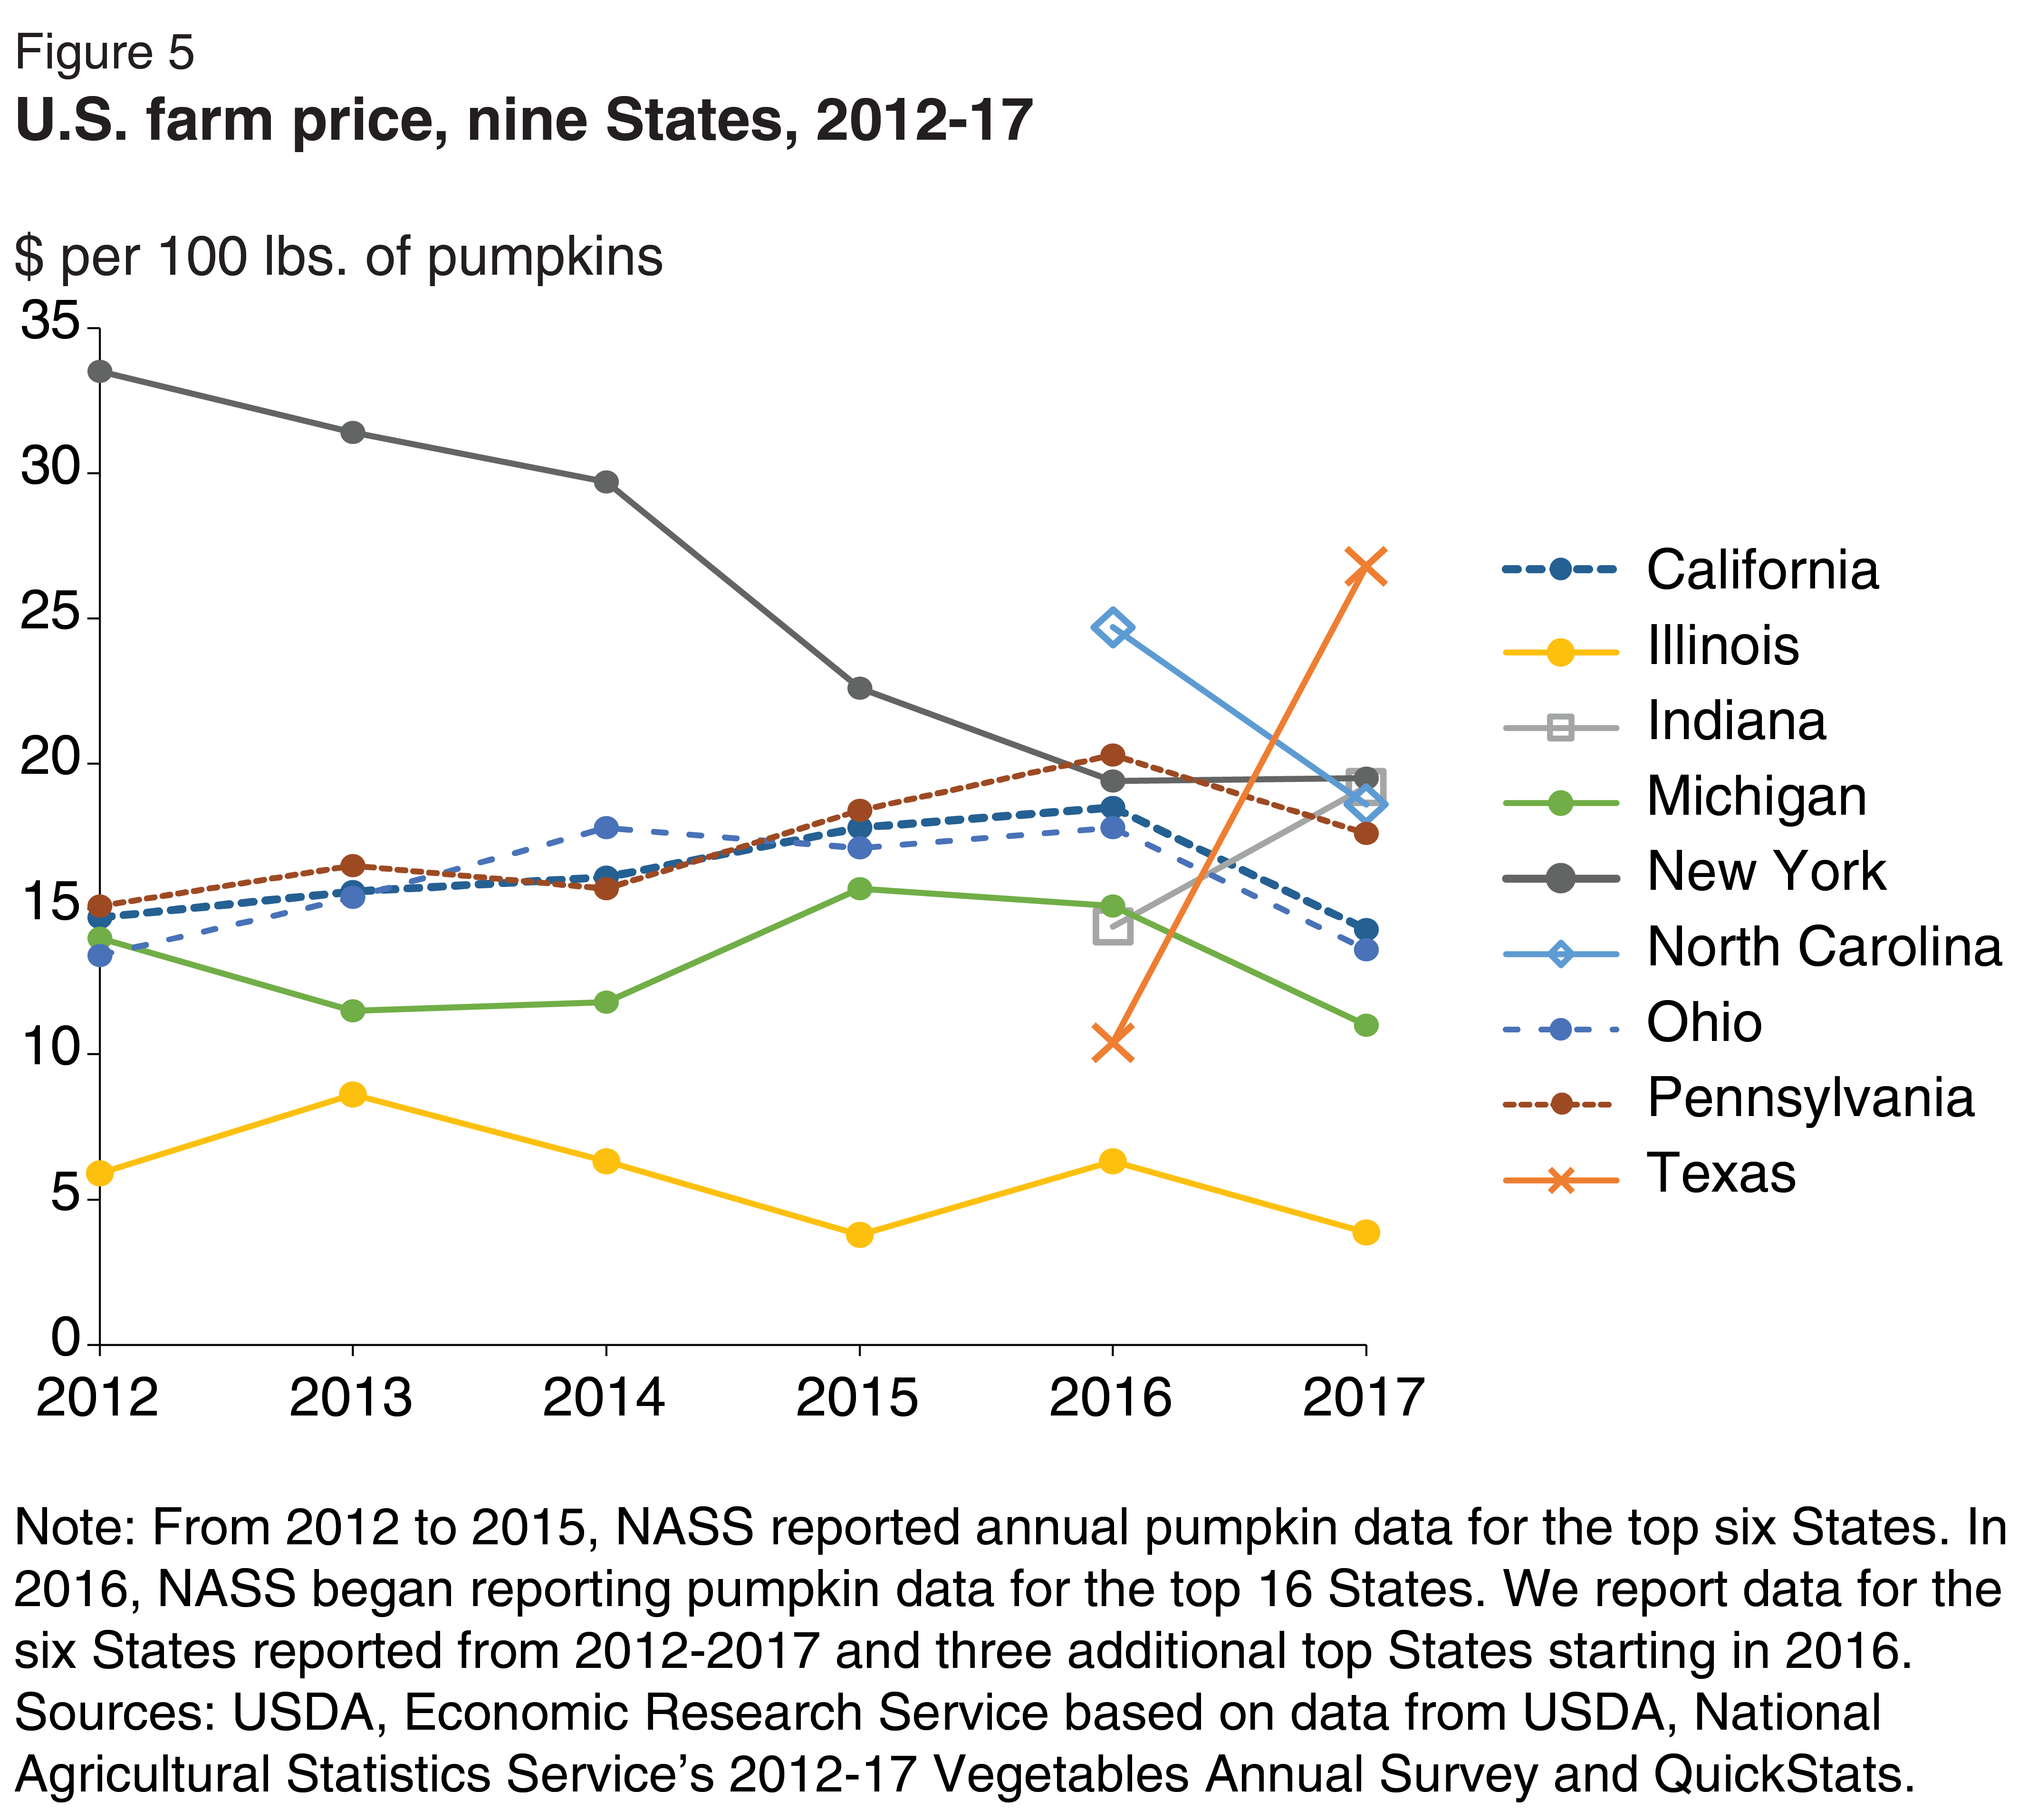
While all States see year-to-year changes in price, New York—where prices steeply declined from 2012 to 2016—and Texas—where prices more than doubled from 2016 to 2017 after late rains made harvest challenging—have experienced the most stark trends. Illinois growers consistently receive the lowest price because the majority of their pumpkins are sold for processing.
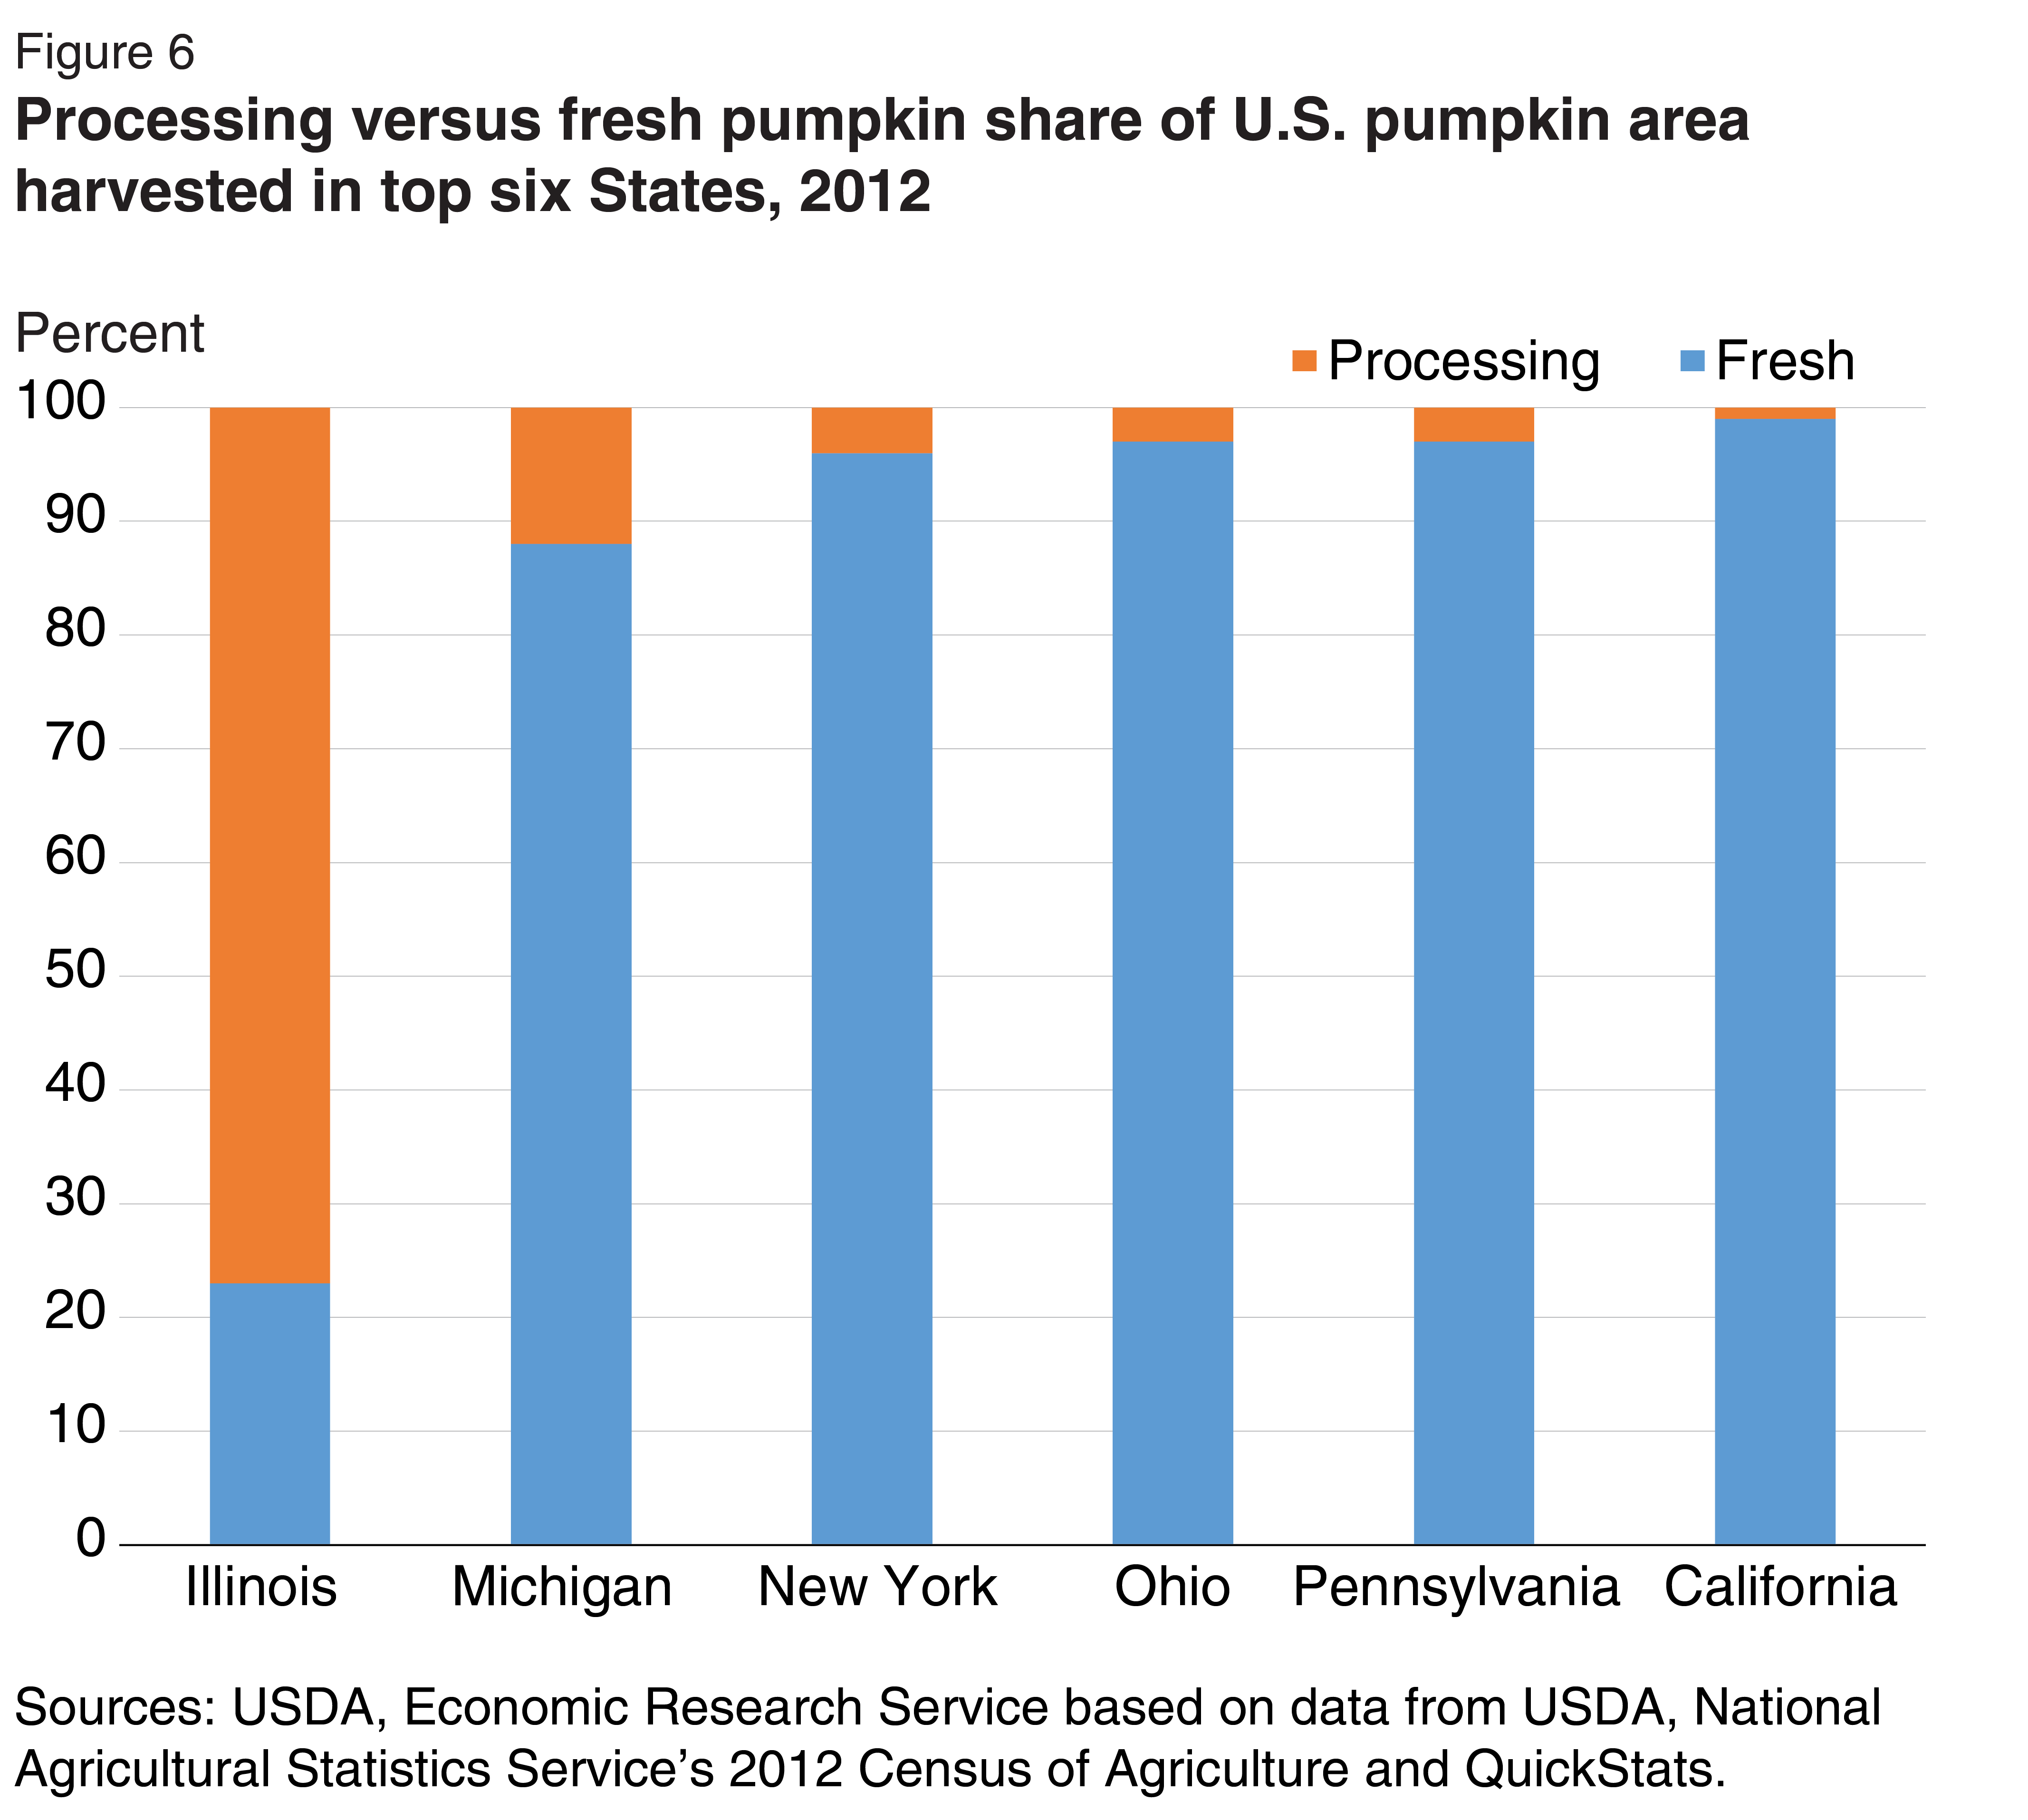
Illinois harvests the largest share of pumpkin acreage among all States and an even larger share of processing acres. Almost 80 percent of pumpkin acres in Illinois are devoted to pie filling or other processing uses, compared to a little over 10 percent in Michigan (Figure 5).
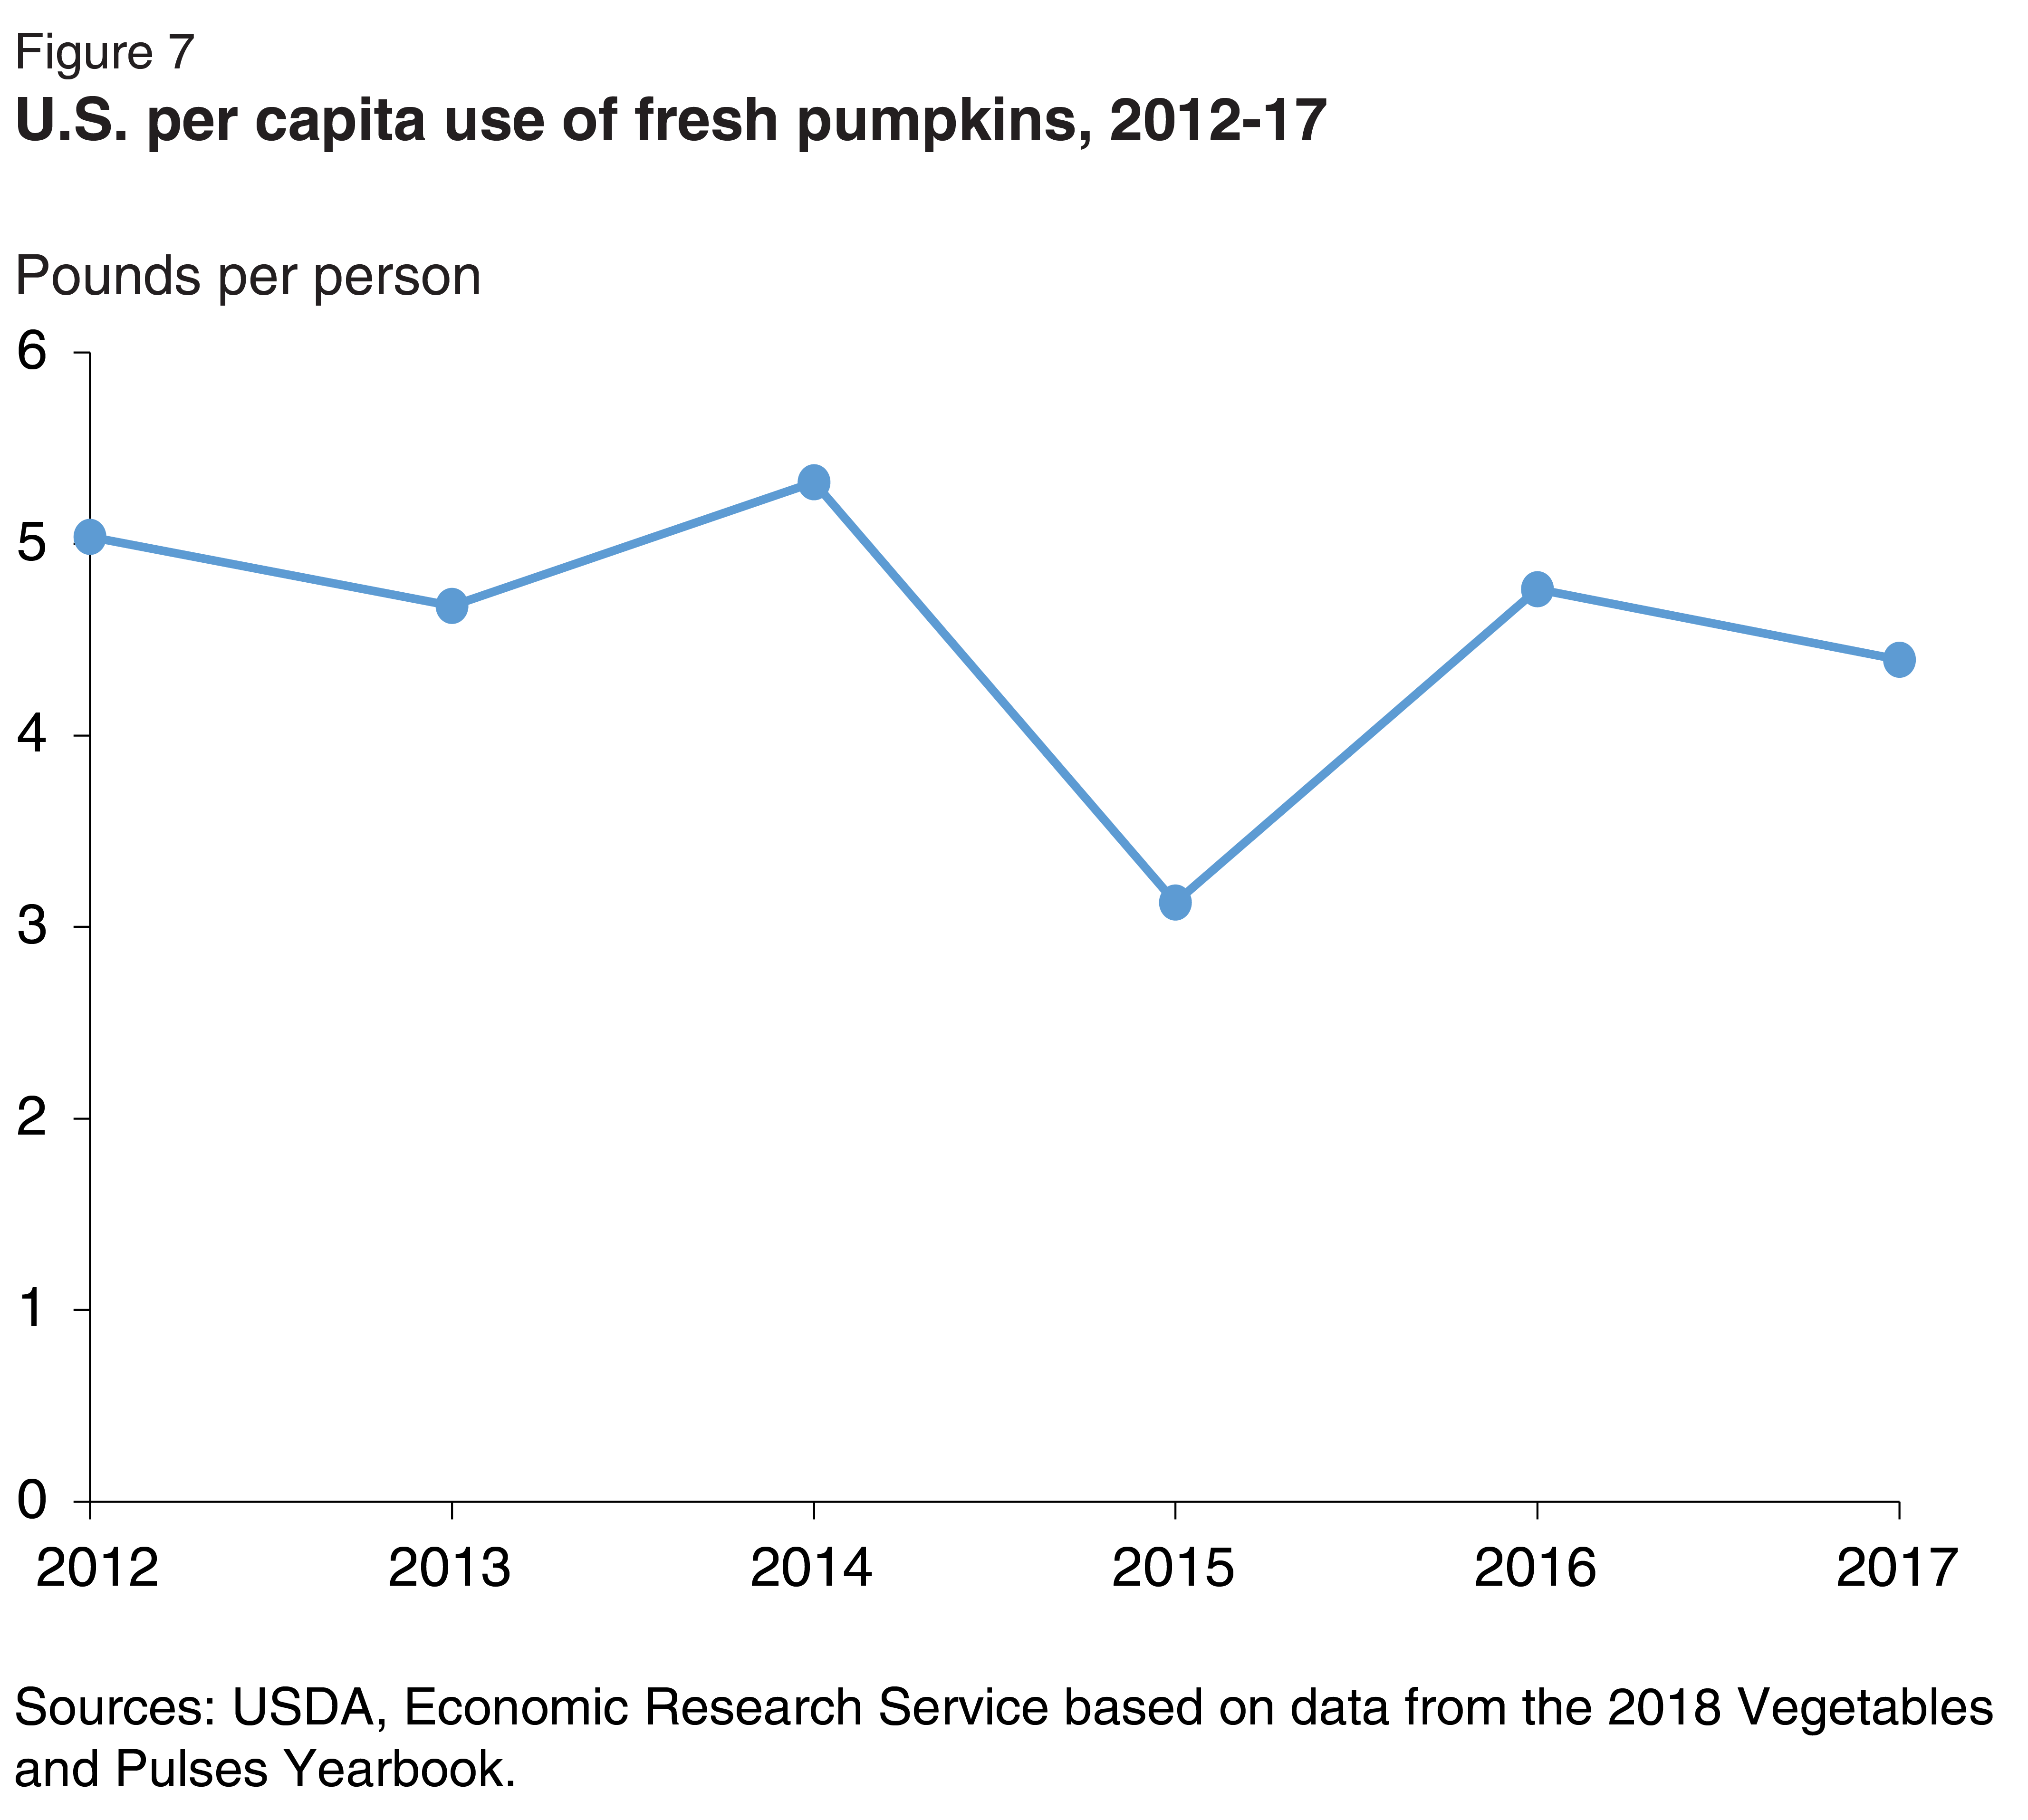
Annual per capita use of fresh pumpkins averaged 4.5 pounds per person over 2012-17 (Figure 7). Reduced use in 2015 corresponds to reductions in supply.
Initial reports for 2018 pumpkin production indicate healthy crops in Illinois and California. However, some reports from Michigan indicate a challenging year for pumpkins due to early drought, recent downpours, and disease. In some areas of North Carolina with excessive rain during the summer, the pumpkin crop was reduced somewhat due to disease, but Hurricane Florence missed the top producing county, Chowan.
Pumpkin supplies from most States are targeted toward the seasonal fresh market for ornamental uses and home processing. Growers mainly produce jack-o’-lantern type pumpkins (Howden), but demand for specialty pumpkins—like White Howden, Blue, Cinderella, and Fairytale— continues to expand as consumers look for new and interesting varieties (Table 1). In the first week of September 2018, retail prices were up 6 percent from the same time last year (Table 2). The 12 percent, September 2nd week drop in national prices was associated with a large drop in prices in the southeast region, where Hurricane Florence impacted both producers and consumers.
(Wholesale and retail advertised prices will continue to be updated during the 2018 fall season as they become available.)
| Week, 2018 | Pie (Medium) |
Howden (Medium) |
Howden (Large) |
White Howden (Large) |
Blue (Large) |
Cinderella (Large) |
Fairytale (Large) |
|---|---|---|---|---|---|---|---|
| September, 1st Week | $175 | N/A | N/A | $180 | N/A | $257 | $252 |
| September, 2nd Week | $199 | N/A | N/A | $180 | $175 | $208 | $227 |
| September, 3rd Week | $224 | $122 | $128 | $180 | $175 | $208 | $227 |
| September, 4th Week | $224 | $121 | $130 | $180 | $175 | $220 | $227 |
| October, 1st Week | $219 | $126 | $130 | $180 | $175 | $220 | $227 |
| October, 2nd Week | $219 | $131 | $130 | $180 | $175 | $208 | $227 |
| October, 3rd Week | $224 | $131 | $130 | $180 | $175 | $208 | $227 |
| Note: Price is a weekly average of all quoted markets (excluding organic) for the listed type.
Source: Market News, Terminal Market Report. USDA, Agricultural Marketing Service (AMS). |
|||||||
| Date | 2018 | 2017 |
|---|---|---|
| September, 1st Week | $4.42 | $4.15 |
| September, 2nd Week | $3.89 | $4.32 |
| September, 3rd Week | $4.39 | $4.51 |
| September, 4th Week | $4.29 | $4.12 |
| October, 1st Week | $3.32 | $4.38 |
| October, 2nd Week | $4.00 | $4.12 |
| October, 3rd Week | $3.67 | $3.89 |
| Source: Market News, Retail Report. USDA, Agricultural Marketing Service (AMS). | ||


Current Issue

Tech allows growers to ‘eavesdrop’ on insects
Southwest Florida’s Worden Farm manages challenges
Pennsylvania Vegetable Growers Association says farewell to leader
Southeast Regional Show recognizes leaders
Veg Connections: Biopesticides and beneficial insects
Business: Why do most succession plans fail?
60 years of advocating for agricultural employers
Keeping CSA members engaged and loyal
see all current issue »